
Page 400 - IJB-9-3
P. 400
International Journal of Bioprinting Bioprinting of a multicellular model
A B
C D
E F
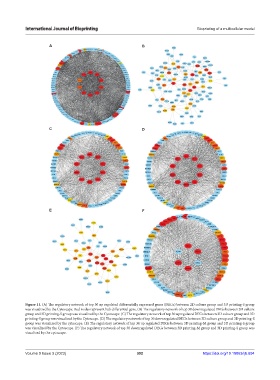
Figure 11. (A) The regulatory network of top 30 up regulated differentially expressed genes (DEGs) between 2D culture group and 3D printing-S group
was visualized by the Cytoscape. Red nodes represent hub differential gene. (B) The regulatory network of top 30 downregulated DEGs between 2D culture
group and 3D printing-S group was visualized by the Cytoscape. (C) The regulatory network of top 30 upregulated DEGs between 3D culture group and 3D
printing-S group was visualized by the Cytoscape. (D) The regulatory network of top 30 downregulated DEGs between 3D culture group and 3D printing-S
group was visualized by the cytoscape. (E) The regulatory network of top 30 up regulated DEGs between 3D printing-M group and 3D printing-S group
was visualized by the Cytoscape. (F) The regulatory network of top 30 downregulated DEGs between 3D printing-M group and 3D printing-S group was
visualized by the cytoscape.
Volume 9 Issue 3 (2023) 392 https://doi.org/10.18063/ijb.694