
Page 197 - IJB-9-4
P. 197
International Journal of Bioprinting b-Ti21S TPMS FGPs produced by laser powder bed fusion
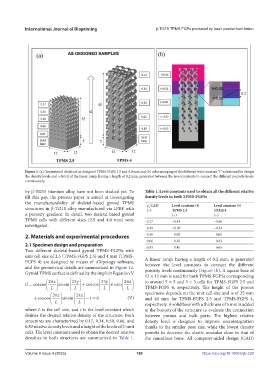
Figure 1. (a) Geometrical details of as-designed TPMS-FGPS 2.5 and 4.0 mm and (b) color mapping of the different level constant “t” values used to design
the density levels and a detail of the linear ramp, having a length of 0.2 mm, generated between the level constants to connect the different porosity levels
continuously.
by b-Ti21S titanium alloy have not been studied yet. To Table 1. Level constants used to obtain all the different relative
fill this gap, the present paper is aimed at investigating density levels in both TPMS-FGPSs
the manufacturability of skeletal-based gyroid TPMS r CAD Level constant (t) Level constant (t)
structures in β-Ti21S alloy manufactured via LPBF with (−) TPMS 2.5 TPMS 4
r
a porosity gradient. In detail, two skeletal-based gyroid (−) (−)
TPMS cells with different sizes (2.5 and 4.0 mm) were 0.17 −0.41 −0.66
investigated.
0.34 −0.20 −0.32
2. Materials and experimental procedures 0.50 0.00 0.00
0.66 0.20 0.32
2.1 Specimen design and preparation 0.83 0.40 0.66
Two different skeletal-based gyroid TPMS–FGPSs with
unit cell size of 2.5 (TPMS-FGPS 2.5) and 4 mm (TPMS- A linear ramp, having a length of 0.2 mm, is generated
FGPS 4) are designed by means of nTopology software, between the level constants to connect the different
and the geometrical details are summarized in Figure 1a. porosity levels continuously (Figure 1b). A square base of
Gyroid TPMS surface is defined by the implicit Equation V 12 × 12 mm is used for both TPMS-FGPSs corresponding
2π x 2π y 2π y 2πz to around 5 × 5 and 3 × 3 cells for TPMS-FGPS 2.5 and
G = coscos L sinsin L +coscos L sinsin L TPMS-FGPS 4, respectively. The height of the porous
2πz 2 2πx specimens depends on the unit cell size and is of 25 mm
+coscos L sinsin L −= 0 (V) and 40 mm for TPMS-FGPS 2.5 and TPMS-FGPS 4,
t
where L is the cell size, and t is the level constant which respectively. A solid base with a thickness of 5 mm is added
at the bottom of the structure to evaluate the connection
defines the desired relative density of the structure. Both between porous and bulk parts. The highest relative
structures are characterized by 0.17, 0.34, 0.50, 0.66, and density level is designed to improve osseointegration
0.83 relative density levels and a height of the levels of 2-unit thanks to the smaller pore size, while the lowest density
cells. The level constants used to obtain the desired relative permits to decrease the elastic modulus close to that of
densities in both structures are summarized in Table 1. the cancellous bone. All computer-aided design (CAD)
Volume 9 Issue 4 (2023) 189 https://doi.org/10.18063/ijb.729