
Page 200 - IJB-9-4
P. 200
International Journal of Bioprinting b-Ti21S TPMS FGPs produced by laser powder bed fusion
Figure 3. Example of wall thickness method results obtained in the case of TPMS 2.5 with a relative density of 0.83: visualization of the thickness
measurement and ligament thickness distribution.
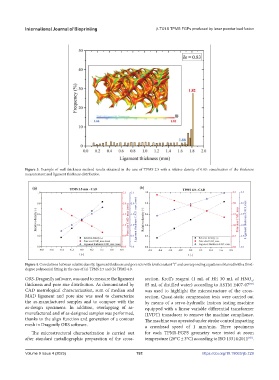
Figure 4. Correlations between relative density, ligament thickness and pore size with level constant “t” and corresponding equations obtained with a third-
degree polynomial fitting in the case of (a) TPMS 2.5 and (b) TPMS 4.0.
ORS-Dragonfly software, was used to measure the ligament section. Kroll’s reagent (1 mL of HF, 30 mL of HNO ,
3
thickness and pore size distribution. As demonstrated by 85 mL of distilled water) according to ASTM E407-07
[59]
CAD metrological characterization, sum of median and was used to highlight the microstructure of the cross-
MAD ligament and pore size was used to characterize section. Quasi-static compression tests were carried out
the as-manufactured samples and to compare with the by means of a servo-hydraulic Instron testing machine
as-design specimens. In addition, overlapping of as- equipped with a linear variable differential transformer
manufactured and of as-designed samples was performed, (LVDT) transducer to remove the machine compliance.
thanks to the align function and generation of a contour The machine was operated under stroke control imparting
mesh in Dragonfly ORS software. a crosshead speed of 1 mm/min. Three specimens
The microstructural characterization is carried out for each TPMS-FGPS geometry were tested at room
after standard metallographic preparation of the cross- temperature (20°C ± 3°C) according to ISO 13314:2011 .
[60]
Volume 9 Issue 4 (2023) 192 https://doi.org/10.18063/ijb.729