
Page 204 - IJB-9-4
P. 204
International Journal of Bioprinting b-Ti21S TPMS FGPs produced by laser powder bed fusion
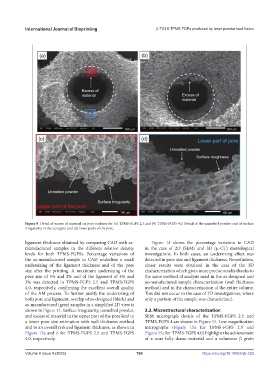
Figure 9. Detail of excess of material on pore surfaces for (a) TPMS-FGPS 2.5 and (b) TPMS-FGPS 4.0. Detail of the unmelted powder and of surface
irregularity in the (c) upper and (d) lower parts of the pore.
ligament thickness obtained by comparing CAD with as- Figure 14 shows the percentage variation to CAD
manufactured samples in the different relative density in the case of 2D (SEM) and 3D (m-CT) metrological
levels for both TPMS-FGPSs. Percentage variations of investigations. In both cases, an undersizing effect was
the as-manufactured sample to CAD underline a small detected in pore size and ligament thickness. Nevertheless,
undersizing of the ligament thickness and of the pore closer results were obtained in the case of the 3D
size after the printing. A maximum undersizing of the characterization which gives more precise results thanks to
pore size of 5% and 2% and of the ligament of 4% and the same method of analysis used in the as-designed and
3% was detected in TPMS-FGPS 2.5 and TPMS-FGPS as-manufactured sample characterization (wall thickness
4.0, respectively, confirming the excellent overall quality method) and to the characterization of the entire volume.
of the AM process. To further justify the undersizing of This did not occur in the case of 2D investigations, where
both pore and ligament, overlap of as-designed (black) and only a portion of the sample was characterized.
as-manufactured (gray) samples in a simplified 2D view is
shown in Figure 13. Surface irregularity, unmelted powder, 3.2. Microstructural characterization
and excess of material in the upper part of the pore lead to SEM micrograph details of the TPMS-FGPS 2.5 and
a lower pore size estimation with wall thickness method TPMS-FGPS 4 are shown in Figure 15. Low magnification
and to an overall reduced ligament thickness, as shown in micrographs (Figure 15a for TPMS-FGPS 2.5 and
Figure 13a and b for TPMS-FGPS 2.5 and TPMS-FGPS Figure 15c for TPMS-FGPS 4.0) highlight the achievement
4.0, respectively. of a near fully dense material and a columnar b grain
Volume 9 Issue 4 (2023) 196 https://doi.org/10.18063/ijb.729