
Page 206 - IJB-9-4
P. 206
International Journal of Bioprinting b-Ti21S TPMS FGPs produced by laser powder bed fusion
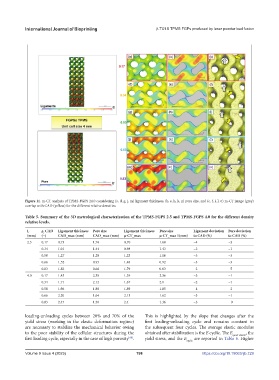
Figure 11. m-CT analysis of TPMS-FGPS 24.0 considering (a, d, g, j, m) ligament thickness, (b, e, h, k, n) pore size, and (c, f, i, l, o) m-CT image (gray)
overlap with CAD (yellow) for the different relative densities.
Table 5. Summary of the 3D metrological characterization of the TPMS-FGPS 2.5 and TPMS-FGPS 4.0 for the different density
relative levels.
L ρ CAD Ligament thickness Pore size Ligament thickness Pore size Ligament deviation Pore deviation
r
(mm) (−) CAD_max (mm) CAD_max (mm) μ-CT_max μ-CT_max 1(mm) to CAD (%) to CAD (%)
2.5 0.17 0.73 1.74 0.70 1.68 −4 −3
0.34 1.01 1.44 0.98 1.43 −3 −1
0.50 1.27 1.20 1.23 1.16 −3 −3
0.66 1.52 0.95 1.48 0.92 −3 −3
0.83 1.82 0.66 1.79 0.63 −2 −5
4.0 0.17 1.43 2.38 1.39 2.36 −3 −1
0.34 1.71 2.12 1.67 2.1 −2 −1
0.50 1.96 1.88 1.89 1.85 −4 −2
0.66 2.20 1.64 2.13 1.62 −3 −1
0.83 2.47 1.36 2.4 1.36 −3 0
loading-unloading cycles between 20% and 70% of the This is highlighted by the slope that changes after the
yield stress (working in the elastic deformation regime) first loading-unloading cycle and remains constant in
are necessary to stabilize the mechanical behavior owing the subsequent four cycles. The average elastic modulus
to the poor stability of the cellular structures during the obtained after stabilization is the E cyclic. The E quasi-elastic , the
[68]
first loading cycle, especially in the case of high porosity . yield stress, and the E cyclic are reported in Table 6. Higher
Volume 9 Issue 4 (2023) 198 https://doi.org/10.18063/ijb.729