
Page 201 - IJB-9-4
P. 201
International Journal of Bioprinting b-Ti21S TPMS FGPs produced by laser powder bed fusion
Table 3. The chemical composition of β-Ti21S (wt.%).
Element Mo Al Nb Si O Ni Fe
Weight % 14.6 2.8 2.8 0.3 0.11 0.004 Bal.
0.3 mm, and its suitability was verified by performing a
convergency analysis. The specimen loading condition
resembled the experimental condition, i.e., a fixed
constraint on the bottom surface of the specimen and
a fixed displacement equal to 0.1 mm in the vertical
direction on the top surface. The elastic modulus was
computed with Equation XII.
FA
E = z (XII)
∆ ll 0
where F is the reaction force on the bottom surface, A is
z
the surface perpendicular to the applied load (around 12 ×
12 mm), Dl is the fixed displacement equal to 0.1 and l is
0
the height of the FGPS samples (around 45 mm in case of
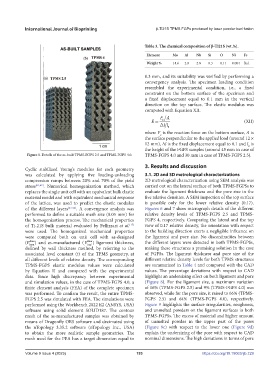
Figure 5. Details of the as-built TPMS-FGPS 2.5 and TPMS-FGPS 4.0. TPMS-FGPS 4.0 and 30 mm in case of TPMS-FGPS 2.5).
3. Results and discussion
Cyclic stabilized Young’s modulus for each geometry
was calculated by applying five loading-unloading 3.1. 2D and 3D metrological characterizations
compression ramps between 20% and 70% of the yield 2D metrological characterization using SEM analysis was
stress [61,62] . Numerical homogenization method, which carried out on the lateral surface of both TPMS-FGPSs to
replaces the single unit cell with an equivalent bulk elastic evaluate the ligament thickness and the pore size in the
material model and with equivalent mechanical response five relative densities. A SEM inspection of the top surface
of the lattice, was used to predict the elastic modulus is possible only for the lower relative density (0.17).
of the different layers [63-66] . A convergence analysis was Figures 6 and 7 show micrograph details of the different
performed to define a suitable mesh size (0.05 mm) for relative density levels of TPMS-FGPS 2.5 and TPMS-
the homogenization process. The mechanical properties FGPS 4, respectively. Comparing the lateral and the top
of Ti-21S bulk material evaluated by Pellizzari et al. view of 0.17 relative density, the orientation with respect
[17]
were used. The homogenized mechanical properties to the building direction exerts a negligible influence on
were computed both on unit cell with as-designed the ligament and pore size. No discontinuities between
hom
(E nom ) and as-manufactured (E hom ) ligament thickness, the different layers were detected in both TPMS-FGPSs,
. real
defined by wall thickness method, by referring to the making these structures a promising solution in the case
associated level constant (t) of the TPMS geometry, at of FGPSs. The ligament thickness and pore size of the
all different levels of relative density. The corresponding different relative density levels for both TPMS structures
TPMS-FGPS elastic modulus values were calculated are summarized in Table 4 and compared with the CAD
by Equation II and compared with the experimental values. The percentage deviations with respect to CAD
data. Since high discrepancy between experimental highlight an undersizing effect on both ligament and pore
and simulation values, in the case of TPMS-FGPS 4.0, a (Figure 8). For the ligament size, a maximum variation
finite element analysis (FEA) of the complete specimen of 16% (TPMS-FGPS 2.5) and 9% (TPMS-FGPS 4.0) was
was performed. To confirm the result, the entire TPMS- observed, while for the pore size, it raised to 66% (TPMS-
FGPS 2.5 was simulated with FEA. The simulations were FGPS 2.5) and 64% (TPMS-FGPS 4.0), respectively.
performed using the Workbench 2022 R2 (ANSYS, USA) Figure 9 highlights the surface irregularities, roughness,
software using solid element SOLID187. The contour and unmelted powders on the ligament surfaces in both
mesh of the as-manufactured samples was obtained by TPMS-FGPSs. The excess of material and higher amount
means of Dragonfly ORS software and decimated using of unmelted powder in the upper part of the pores
the nTopology 3.35.2 software (nTopology Inc., USA) (Figure 9c) with respect to the lower one (Figure 9d)
to obtain the more realistic sample geometries. The explain the undersizing of the pore with respect to CAD
mesh used for the FEA has a target dimension equal to nominal dimensions. The high deviations in terms of pore
Volume 9 Issue 4 (2023) 193 https://doi.org/10.18063/ijb.729