
Page 198 - IJB-9-4
P. 198
International Journal of Bioprinting b-Ti21S TPMS FGPs produced by laser powder bed fusion
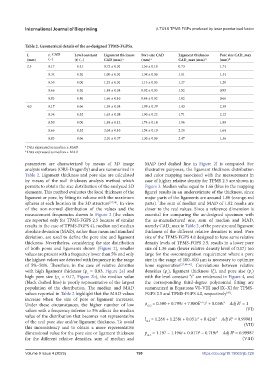
Table 2. Geometrical details of the as-designed TPMS-FGPSs.
L r CAD Level constant Ligament thickness Pore size CAD Ligament thickness Pore size CAD_max
r
(mm) (−) (t) (−) CAD (mm) a (mm) a CAD_max (mm) b (mm) b
2.5 0.17 −0.41 0.72 ± 0.01 1.56 ± 0.18 0.73 1.74
0.34 −0.20 1.00 ± 0.01 1.38 ± 0.06 1.01 1.44
0.50 0.00 1.25 ± 0.01 1.15 ± 0.05 1.27 1.20
0.66 0.20 1.48 ± 0.04 0.92 ± 0.03 1.52 0.95
0.83 0.40 1.66 ± 0.16 0.64 ± 0.02 1.82 0.66
4.0 0.17 −0.66 1.39 ± 0.04 1.99 ± 0.39 1.43 2.38
0.34 −0.32 1.63 ± 0.08 1.90 ± 0.22 1.71 2.12
0.50 0.00 1.84 ± 0.12 1.74 ± 0.14 1.96 1.88
0.66 0.32 2.04 ± 0.16 1.54 ± 0.10 2.20 1.64
0.83 0.66 2.10 ± 0.37 1.30 ± 0.06 2.47 1.36
a Data expressed as median ± MAD
b Data expressed as median + MAD
parameters are characterized by means of 3D image MAD (red dashed line in Figure 2) is computed. For
analysis software (ORS-Dragonfly) and are summarized in illustrative purposes, the ligament thickness distribution
Table 2. Ligament thickness and pore size are calculated and color mapping associated with the measurement in
by means of the wall thickness analysis method which case of higher relative density for TPMS 2.5 are shown in
permits to obtain the size distribution of the analyzed 3D Figure 3. Median value equal to 1.66 (blue in the mapping
elements. This method evaluates the local thickness of the figure) results in an underestimate of the thickness, since
ligament or pore, by fitting its volume with the maximum major parts of the ligaments are around 1.80 (orange-red
spheres at each location in the 3D structure [57,58] . In view parts). The sum of median and MAD of 1.82 results are
of the non-normal distribution of the values and the closer to the real values. Since a reference dimension is
measurement frequencies shown in Figure 2 (the values essential for comparing the as-designed specimen with
are reported only for TPMS-FGPS 2.5 because of similar the as-manufactured one, sum of median and MAD,
results in the case of TPMS-FGPS 4), median and median namely CAD_max in Table 2, of the pore size and ligament
absolute deviation (MAD), rather than mean and standard thickness of the different relative densities is used. Pore
deviation, are used to define the pore size and ligament size of the TPMS-FGPS 4.0 designed to have same relative
thickness. Nevertheless, considering the size distribution density levels of TPMS-FGPS 2.5, results in a lower pore
of both pores and ligaments shown (Figure 2), smaller size of 1.36 mm (lower relative density level of 0.17) too
values are present with a frequency lower than 5% and only large for the osseointegration requirement where a pore
the highest values are detected with frequency in the range size in the range of 100–600 mm is necessary to optimize
of 5%–50%. Therefore, in the case of relative densities bone regeneration [25,44-46] . Correlations between relative
with high ligament thickness (r = 0.83, Figure 2a) and densities (r ), ligament thickness (l ), and pore size (p )
t
r
s
r
high pore size (r = 0.17, Figure 2b), the median value with the level constant “t” are evidenced in Figure 4, and
r
(black dashed line) is poorly representative of the largest the corresponding third-degree polynomial fitting are
population of the distribution. The median and MAD summarized in Equations VI–VIII and IX–XI for TPMS-
values reported in Table 2 highlight that the MAD values FGPS 2.5 and TPMS-FGPS 4.0, respectively .
[47]
increase when the size of pore or ligament increases.
2
3
-17 2
Under these circumstances, the higher number of low ρ = 0.500 + 0.799t + 7.080E t + 0.038t Adj R = 1
r2.5
values with a frequency inferior to 5% affects the median (VI)
value of the distribution that becomes not representative l = 1.266 + 1.258t + 0.051t + 0.424t Adj R = 0.99981
2
3
2
of the real pore size and/or ligament thickness. To avoid t2.5 (VII)
this inconsistency and to obtain a more representative
dimensional value for the pore size or ligament thickness p = 1.197 − 1.196t + 0.017t − 0.719t Adj R = 0.99987
2
2
3
s2.5
for the different relative densities, sum of median and (VIII)
Volume 9 Issue 4 (2023) 190 https://doi.org/10.18063/ijb.729