
Page 199 - IJB-9-4
P. 199
International Journal of Bioprinting b-Ti21S TPMS FGPs produced by laser powder bed fusion
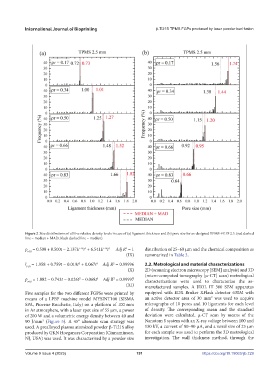
Figure 2. Size distributions of all five relative density levels in case of (a) ligament thickness and (b) pore size for as-designed TPMS-FGPS 2.5. (red dashed
line = median + MAD; black dashed line = median).
ρ = 0.500 + 0.500t − 2.137E t + 6.541E t Adj R = 1 distribution of 25–60 mm and the chemical composition as
−16 3
−16 2
2
r4.0
(IX) summarized in Table 3.
l = 1.958 + 0.759t − 0.019t + 0.067t Adj R = 0.99996 2.2. Metrological and material characterizations
2
2
3
t4.0
(X) 2D (scanning electron microscopy [SEM] analysis) and 3D
(micro-computed tomography [m-CT] scan) metrological
p = 1.882 − 0.743t − 0.026t − 0.068t Adj R = 0.99997 characterizations were used to characterize the as-
2
2
3
s4.0
(XI) manufactured samples. A JEOL IT 300 SEM apparatus
Five samples for the two different FGPSs were printed by equipped with EDX Bruker XFlash detector 630M with
means of a LPBF machine model MYSINT100 (SISMA an active detector area of 30 mm was used to acquire
2
SPA, Piovene Rocchette, Italy) on a platform of 100 mm micrographs of 10 pores and 10 ligaments for each level
in Ar atmosphere, with a laser spot size of 55 mm, a power of density. The corresponding mean and the standard
of 200 W and a volumetric energy density between 40 and deviation were calculated. m-CT scan by means of the
90 J/mm (Figure 5). A 45° alternate scan strategy was Nanotom S system with an X-ray voltage between 100 and
3
used. A prealloyed plasma atomized powder b-Ti21S alloy 130 kV, a current of 80–90 mA, and a voxel size of 25 mm
produced by GKN Hoeganaes Corporation (Cinnaminson, for each sample was used to perform the 3D metrological
NJ, USA) was used. It was characterized by a powder size investigation. The wall thickness method, through the
Volume 9 Issue 4 (2023) 191 https://doi.org/10.18063/ijb.729