
Page 203 - IJB-9-4
P. 203
International Journal of Bioprinting b-Ti21S TPMS FGPs produced by laser powder bed fusion
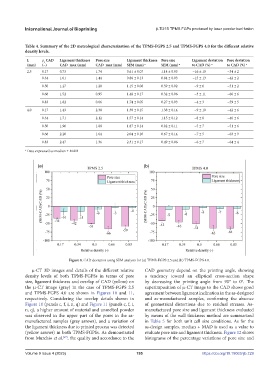
Table 4. Summary of the 2D metrological characterization of the TPMS-FGPS 2.5 and TPMS-FGPS 4.0 for the different relative
density levels.
L r CAD Ligament thickness Pore size Ligament thickness Pore size Ligament deviation Pore deviation
r
(mm) (−) CAD_max (mm) CAD_max (mm) SEM (mm) a SEM (mm) a to CAD (%) a to CAD (%) a
2.5 0.17 0.73 1.74 0.61 ± 0.07 1.14 ± 0.03 −16 ± 10 −34 ± 2
0.34 1.01 1.44 0.86 ± 0.13 0.84 ± 0.03 −15 ± 13 −42 ± 2
0.50 1.27 1.20 1.15 ± 0.08 0.59 ± 0.02 −9 ± 6 −51 ± 2
0.66 1.52 0.95 1.48 ± 0.17 0.32 ± 0.06 −3 ± 11 −66 ± 6
0.83 1.82 0.66 1.74 ± 0.05 0.27 ± 0.03 −4 ± 3 −59 ± 5
4.0 0.17 1.43 2.38 1.30 ± 0.15 1.38 ± 0.14 −9 ± 10 −42 ± 6
0.34 1.71 2.12 1.57 ± 0.14 1.15 ± 0.12 −8 ± 8 −46 ± 6
0.50 1.96 1.88 1.87 ± 0.14 0.92 ± 0.11 −5 ± 7 −51 ± 6
0.66 2.20 1.64 2.04 ± 0.10 0.67 ± 0.14 −7 ± 5 −63 ± 9
0.83 2.47 1.36 2.31 ± 0.17 0.49 ± 0.06 −6 ± 7 −64 ± 4
a Data expressed as median ± MAD
Figure 8. CAD deviation using SEM analysis for (a) TPMS-FGPS 2.5 and (b) TPMS-FGPS 4.0.
m-CT 3D images and details of the different relative CAD geometry depend on the printing angle, showing
density levels of both TPMS-FGPSs in terms of pore a tendency toward an elliptical cross-section shape
size, ligament thickness and overlap of CAD (yellow) on by decreasing the printing angle from 90° to 0°. The
the m-CT image (gray) in the case of TPMS-FGPS 2.5 superimposition of m-CT image to the CAD shows good
and TPMS-FGPS 4.0 are shown in Figures 10 and 11, agreement between ligament inclination in the as-designed
respectively. Considering the overlap details shown in and as-manufactured samples, confirming the absence
Figure 10 (panels c, f, i, n, q) and Figure 11 (panels c, f, i, of geometrical distortions due to residual stresses. As-
n, q), a higher amount of material and unmelted powder manufactured pore size and ligament thickness evaluated
was observed in the upper part of the pores in the as- by means of the wall thickness method are summarized
manufactured samples (gray arrows), and a variation of in Table 5 for both unit cell size conditions. As for the
the ligament thickness due to printed process was detected as-design samples, median + MAD is used as a value to
(yellow arrows) in both TPMS-FGPSs. As demonstrated evaluate pore size and ligament thickness. Figure 12 shows
from Murchio et al. , the quality and accordance to the histograms of the percentage variations of pore size and
[67]
Volume 9 Issue 4 (2023) 195 https://doi.org/10.18063/ijb.729