
Page 205 - IJB-9-4
P. 205
International Journal of Bioprinting b-Ti21S TPMS FGPs produced by laser powder bed fusion
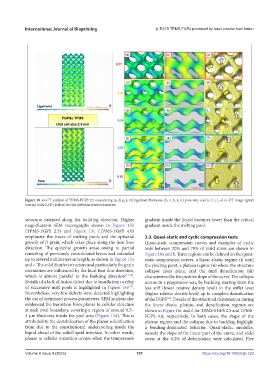
Figure 10. m-CT analysis of TPMS-FGPS 2.5 considering (a, d, g, j, m) ligament thickness, (b, e, h, k, n) pore size, and (c, f, i, l, o) m-CT image (gray)
overlap with CAD (yellow) for the different relative densities.
structure oriented along the building direction. Higher gradient inside the liquid becomes lower than the critical
magnification SEM micrographs shown in Figure 15b gradient inside the melting pool.
(TPMS-FGPS 2.5) and Figure 15c (TPMS-FGPS 4.0)
emphasize the traces of melting pools and the epitaxial 3.3. Quasi-static and cyclic compression tests
growth of b grain, which takes place along the heat flow Quasi-static compression curves and examples of cyclic
direction. The epitaxial growth arose owing to partial tests between 20% and 70% of yield stress are shown in
remelting of previously consolidated layers and extended Figure 16a and b. Three regions can be defined on the quasi-
up to several millimeters in length, as shown in Figure 15a static compression curves: a linear elastic regime (i) until
and c. The solidification structure and particularly the grain the yielding point, a plateau regime (ii) where the structure
orientation are influenced by the local heat flow direction, collapse takes place, and the final densification (iii)
which is almost parallel to the building direction [17,18] . characterized by the positive slope of the curve. The collapse
Details of a lack of fusion defect due to insufficient overlap occurs in a progressive way, by buckling starting from the
of successive melt pools is highlighted in Figure 15e . less stiff (lower relative density level) to the stiffer level
[27]
Nevertheless, very few defects were detected highlighting (higher relative density level) up to complete densification
the use of optimized process parameters. SEM analysis also of the FGPS . Details of the structural deformation during
[30]
evidenced the transition from planar to cellular structure the linear elastic, plateau, and densification regimes are
at melt pool boundary, covering a region of around 0.5– shown in Figure 16c and d for TPMS-FGPS 2.5 and TPMS-
1 mm thickness inside the pool area (Figure 15d). This is FGPS 4.0, respectively. In both cases, the shape of the
attributed to the destabilization of the planar solidification plateau regime and the collapse due to buckling highlight
front due to the constitutional undercooling inside the a bending-dominated behavior. Quasi-elastic modulus,
liquid ahead of the solid/liquid interface. In other words, namely the slope of the linear part of the curve, and yield
planar to cellular transition occurs when the temperature stress at the 0.2% of deformation were calculated. Five
Volume 9 Issue 4 (2023) 197 https://doi.org/10.18063/ijb.729