
Page 28 - IJB-9-4
P. 28
International Journal of Bioprinting Lattice-Solid hybrid 3D printing for artificial implant
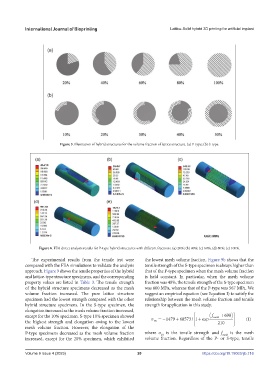
Figure 5. Illustration of hybrid structures for the volume fraction of lattice structure. (a) P-type; (b) S-type.
Figure 6. FEA direct analysis results for P-type hybrid structures with different fractions. (a) 20%; (b) 40%; (c) 60%; (d) 80%; (e) 100%.
The experimental results from the tensile test were the lowest mesh volume fraction. Figure 9b shows that the
compared with the FEA simulations to validate the analysis tensile strength of the S-type specimen is always higher than
approach. Figure 9 shows the tensile properties of the hybrid that of the P-type specimen when the mesh volume fraction
and lattice-type structure specimens, and the corresponding is held constant. In particular, when the mesh volume
property values are listed in Table 3. The tensile strength fraction was 40%, the tensile strength of the S-type specimen
of the hybrid structure specimens decreased as the mesh was 600 MPa, whereas that of the P-type was 567 MPa. We
volume fraction increased. The pure lattice structure suggest an empirical equation (see Equation I) to satisfy the
specimen had the lowest strength compared with the other relationship between the mesh volume fraction and tensile
hybrid structure specimens. In the S-type specimen, the strength for application in this study.
elongation increased as the mesh volume fraction increased,
except for the 10% specimen. S-type 10% specimen showed σ =−1479 +68573 1 exp f ( mesh +690 ) (I)
/
+
the highest strength and elongation owing to the lowest TS 210
mesh volume fraction. However, the elongation of the
P-type specimens decreased as the mesh volume fraction where σ is the tensile strength and f mesh is the mesh
TS
increased, except for the 20% specimen, which exhibited volume fraction. Regardless of the P- or S-type, tensile
Volume 9 Issue 4 (2023) 20 https://doi.org/10.18063/ijb.716