
Page 31 - IJB-9-4
P. 31
International Journal of Bioprinting Lattice-Solid hybrid 3D printing for artificial implant
Table 3. Tensile test results of P-type and S-type specimens.
Specimens Yield strength (MPa) Tensile strength (MPa) Elongation (%) Max von Mises stress (MPa)
P-type 20% 2 mm – 759 0.9 46.2
P-type 40% 2 mm 525 567 3.8 99.5
P-type 60% 2 mm 364 394 2.4 342.3
P-type 80% 2 mm 211 235 2.4 961.6
S-type 10% 2 mm 863 913 5.7 37.9
S-type 20% 2 mm 734 766 1.7 46.2
S-type 30% 2 mm 674 701 1.7 60.5
S-type 40% 2 mm 566 600 2.8 55.9
S-type 50% 2 mm 483 513 3.9 57.5
2mm L0P45 85 117 2.4 –
2mm L45P0 81 107 2.6 –
3mm L0P0 2.5 3.0 2.6 –
3mm L0P45 27 42 3.1 –
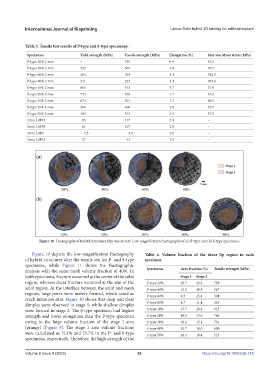
Figure 10. Fractography of hybrid structures after tensile test. Low-magnification fractography of (a) P-type and (b) S-type specimens.
Figure 10 depicts the low-magnification fractography Table 4. Volume fraction of the shear lip region in each
of hybrid structures after the tensile test for P- and S-type specimen
specimens, while Figure 11 shows the fractographic
analysis with the same mesh volume fraction of 40%. In Specimens Area fraction (%) Tensile strength (MPa)
both specimens, fracture occurred at the center of the solid Stage 1 Stage 2
region, whereas shear fracture occurred at the rim of the P-type 20% 29.7 43.3 759
solid region. At the interface between the solid and mesh P-type 40% 15.1 36.5 567
regions, large pores were mainly formed, which acted as P-type 60% 9.3 25.8 394
crack initiation sites. Figure 10 shows that deep and clear
dimples were observed in stage 1, while shallow dimples P-type 80% 4.7 11.4 235
were formed in stage 2. The S-type specimen had higher S-type 10% 37.7 28.1 913
strength and lower elongation than the P-type specimen S-type 20% 46.6 13.6 766
owing to the large volume fraction of the stage 1 area S-type 30% 36.1 15.1 701
(orange) (Figure 9). The stage 1 area volume fractions S-type 40% 25.7 18.0 600
were calculated as 15.1% and 25.7% in the P- and S-type S-type 50% 26.3 10.4 513
specimens, respectively. Therefore, the high strength of the
Volume 9 Issue 4 (2023) 23 https://doi.org/10.18063/ijb.716