
Page 315 - IJB-9-4
P. 315
International Journal of Bioprinting Biomechanical properties of 3D printable materialv
Table 5. Biomechanical properties of the RGD450+TangoPlus material according to different thicknesses and SH
Shore degree Expected thickness Measured thickness Failure stress (MPa) Maximum elastic modulus (MPa)
(mm) (mm) Direction A Direction B Direction A Direction B
70 SH 2 1.97 0.92 0.82 3.71 3.82
60 SH 2 1.98 0.48 0.57 2.91 2.64
50 SH 2 2.37 0.31 0.26 1.04 1.06
2.5 2.81 0.22 0.20 1.25 1.11
3 3.37 0.21 0.16 1.13 1.09
3.5 3.91 0.22 0.22 1.06 1.06
40 SH 2.5 2.78 0.18 0.15 1.05 0.99
3 3.44 0.16 0.14 0.82 0.95
3.5 4.19 0.17 0.17 0.75 0.70
4 4.49 0.20 0.18 0.74 0.76
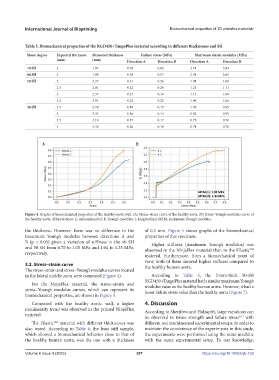
Figure 4. Graphs of biomechanical properties of the healthy aortic wall. (A) Strain–stress curve of the healthy aorta. (B) Stress–Young’s modulus curve of
the healthy aorta. Abbreviations: C, circumferential; E, Young’s modulus; L, longitudinal; MYM, maximum Young’s modulus.
the thickness. However, there was no difference in the of 0.5 mm. Figure 5 shows graphs of the biomechanical
maximum Young’s modulus between directions A and properties of this specimen.
B (p > 0.05) given a variation of stiffness in the 40 SH Higher stiffness (maximum Young’s modulus) was
and 50 SH from 0.70 to 1.05 MPa and 1.04 to 1.25 MPa, observed in the NinjaFlex material than in the Filastic
TM
respectively.
material. Furthermore, from a biomechanical point of
view, both of them showed higher stiffness compared to
3.2. Stress–strain curve the healthy human aorta.
The stress–strain and stress–Young’s modulus curves located
in the lateral middle aorta were computed (Figure 4). According to Table 5, the 2-mm-thick 50-SH
RGD450+TangoPlus material had a similar maximum Young’s
For the NinjaFlex material, the stress–strain and modulus value as the healthy human aorta. However, it had a
stress–Young’s modulus curves, which can represent its lower failure stress value than the healthy aorta (Figure 7).
biomechanical properties, are shown in Figure 5.
Compared with the healthy aortic wall, a higher 4. Discussion
nonlinearity trend was observed in the printed NinjaFlex According to Sherifova and Holzapfel, large variations can
material.
be observed in tissue strength and failure stress with
[11]
The Filastic material with different thicknesses was different test machines and experimental setups. In order to
TM
also tested. According to Table 4, the least stiff sample, maintain the consistency of the experiments in this study,
which showed a biomechanical behavior close to that of the experiments were performed using the same machine
the healthy human aorta, was the one with a thickness with the same experimental setup. To our knowledge,
Volume 9 Issue 4 (2023) 307 https://doi.org/10.18063/ijb.736