
Page 463 - IJB-9-4
P. 463
International Journal of Bioprinting β-Ti21S auxetic FGPs produced by laser powder bed fusion
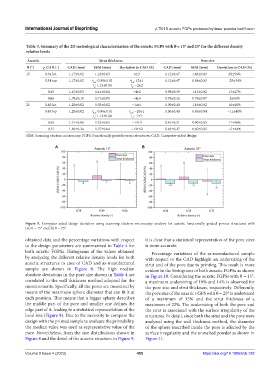
Table 3. Summary of the 2D metrological characterization of the auxetic FGPS with θ = 15° and 25° for the different density
relative levels
Auxetic Strut thickness Pore size
θ (°) ρ CAD (‑) CAD (mm) SEM (mm) Deviation to CAD (%) CAD (mm) SEM (mm) Deviation to CAD (%)
r
15 0.34 lat. 1.17±0.02 1.10±0.03 6±2 1.12±0.47 1.43±0.03 28±56%
0.34 top 1.17±0.02 t : 0.99±0.02 t : 15±1 1.12±0.47 0.84±0.03 −25±34%
bd
bd
t : 1.15±0.04 t : −2±2
x
x
0.49 1.47±0.03 1.41±0.04 −4±2 0.98±0.39 1.11±0.02 13±47%
0.66 1.78±0.10 1.71±0.05 −4±5 0.78±0.32 0.79±0.07 1±51%
25 0.40 lat. 1.20±0.02 1.03±0.02 −14±1 1.00±0.40 1.16±0.02 16±48%
0.40 top 1.20±0.02 t : 0.96±0.01 t : −20±1 1.00±0.40 0.89±0.04 −11±40%
bd
bd
t : 1.12±0.08 t : -7±7
x x
0.58 1.51±0.06 1.32±0.05 −13±3 0.81±0.31 0.90±0.03 11±46%
0.75 1.80±0.24 1.57±0.04 −13±12 0.63±0.27 0.60±0.02 −5±44%
SEM: Scanning electron microscopy, FGPS: Functionally graded porous structures, CAD: Computer-aided design
A B
Figure 5. Computer-aided design deviation using scanning electron microscopy analysis for auxetic functionally graded porous structures with
(A) θ = 15° and (B) θ = 25°.
obtained data and the percentage variations with respect it is clear that a statistical representation of the pore sizes
to the design parameters are summarized in Table 4 for is more accurate.
both auxetic FGPSs. Histograms of the values obtained Percentage variations of the as-manufactured sample
by analyzing the different relative density levels for both with respect to the CAD highlight an undersizing of the
auxetic structures in case of CAD and as-manufactured strut and of the pore due to printing. This result is more
sample are shown in Figure 8. The high median evident in the histograms of both auxetic FGPSs as shown
absolute deviations in the pore size shown in Table 4 are in Figure 10. Considering the auxetic FGPSs with θ = 15°,
correlated to the wall thickness method adopted for the a maximum undersizing of 19% and 14% is observed for
measurements. Specifically, all the pores are measured by the pore size and strut thickness, respectively. Differently,
means of the maximum sphere diameter that can fit it at the pore size of the auxetic FGPS with θ = 25° is undersized
each position. This means that a bigger sphere describes of a maximum of 15% and the strut thickness of a
the middle part of the pore and smaller one defines the maximum of 22%. The undersizing of both the pore and
edge part of it, leading to a statistical representation of the the strut is associated with the surface irregularity of the
local size (Figure 9). Due to the necessity to compare the structures. In detail, since both the strut and the pore were
design with the printed sample to evaluate the printability, analyzed using the wall thickness method, the diameter
the median value was used as representative value of the of the sphere inscribed inside the pore is affected by the
pore. Nevertheless, from the size distributions shown in surface irregularity and the unmelted powder as shown in
Figure 8 and the detail of the auxetic structure in Figure 9, Figure 11.
Volume 9 Issue 4 (2023) 455 https://doi.org/10.18063/ijb.728