
Page 468 - IJB-9-4
P. 468
International Journal of Bioprinting β-Ti21S auxetic FGPs produced by laser powder bed fusion
A B
C
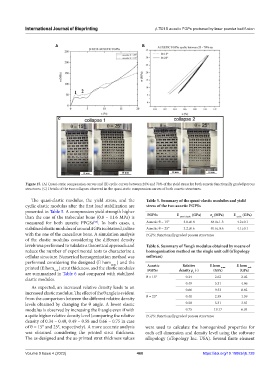
Figure 15. (A) Quasi-static compression curves and (B) cyclic curves between 20% and 70% of the yield stress for both auxetic functionally graded porous
structures. (C) Details of the two collapses observed in the quasi-static compression curves of both auxetic structures.
The quasi-elastic modulus, the yield stress, and the Table 5. Summary of the quasi‑elastic modulus and yield
cyclic elastic modulus after the first load stabilization are stress of the two auxetic FGPSs
presented in Table 5. A compression yield strength higher
than the one of the trabecular bone (0.8 – 11.6 MPa) is FGPSs E quasi‑elastic (GPa) σ (MPa) E cyclic (GPa)
y
measured for both auxetic FPGSs . In both cases, a Auxetic θ = 15° 3.8±0.8 48.0±1.3 4.2±0.1
[55]
stabilized elastic modulus of around 4 GPa is obtained, in line Auxetic θ = 25° 3.2±0.6 40.6±0.6 4.1±0.1
with the one of the cancellous bone. A simulation analysis FGPS: Functionally graded porous structures
of the elastic modulus considering the different density
levels was performed to validate a theoretical approach and Table 6. Summary of Yong’s modulus obtained by means of
reduce the number of experimental tests to characterize a homogenization method on the single unit cell (nTopology
cellular structure. Numerical homogenization method was software)
performed considering the designed (E hom nom. ) and the
Relative
printed (E hom ) strut thickness, and the elastic modules Auxetic density ρ (‑) E hom nom. E hom real.
FGPSs
(GPa)
(GPa)
real.
are summarized in Table 6 and compared with stabilized r
elastic modules. θ = 15° 0.34 2.62 2.02
0.49 5.31 4.86
As expected, an increased relative density leads to an
increased elastic modulus. The effect of the θ angle is evident 0.66 9.53 8.42
from the comparison between the different relative density θ = 25° 0.40 2.58 1.59
levels obtained by changing the θ angle. A lower elastic 0.58 5.31 3.81
modulus is observed by increasing the θ angle even if with 0.75 19.17 6.04
a quite higher relative density level (comparing the relative FGPS: Functionally graded porous structures
density of 0.34 – 0.40, 0.49 – 0.58 and 0.66 – 0.75 in case
of θ = 15° and 25°, respectively). A more accurate analysis were used to calculate the homogenized properties for
was obtained considering the printed strut thickness. each cell dimension and density level using the software
The as-designed and the as-printed strut thickness values nTopology (nTopology Inc. USA). Several finite element
Volume 9 Issue 4 (2023) 460 https://doi.org/10.18063/ijb.728