
Page 469 - IJB-9-4
P. 469
International Journal of Bioprinting β-Ti21S auxetic FGPs produced by laser powder bed fusion
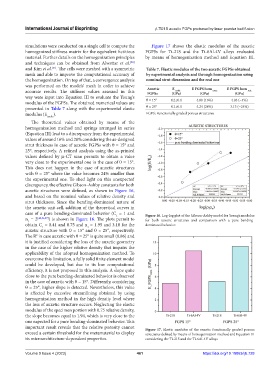
simulations were conducted on a single cell to compute the Figure 17 shows the elastic modulus of the auxetic
homogenized stiffness matrix for the equivalent fictitious FGPSs for Ti-21S and the Ti-6Al-4V alloys evaluated
material. Further details on the homogenization principles by means of homogenization method and Equation III.
and techniques can be obtained from Alwattar et al.
[50]
and Kim et al. . The cells were meshed with a symmetric Table 7. Elastic modulus of the two auxetic FGPSs obtained
[51]
mesh and able to improve the computational accuracy of by experimental analysis and through homogenization using
the homogenization. On top of that, a convergence analysis nominal strut dimension and the real one
was performed on the models’ mesh in order to achieve
E
accurate results. The stiffness values assessed in this Auxetic (GPa) E FGPS hom nom. E FGPS hom real.
cyclic
(GPa)
(GPa)
FGPSs
way were input into Equation III to evaluate the Young’s θ = 15° 4.2±0.1 4.88 (16%) 4.03 (−4%)
modulus of the FGPSs. The obtained numerical values are
presented in Table 7 along with the experimental elastic θ = 25° 4.1±0.1 5.24 (28%) 3.13 (−24%)
modulus (E ). FGPS: Functionally graded porous structures
cyclic
The theoretical values obtained by means of the
homogenization method and springs arranged in series
(Equation III) lead to a discrepancy from the experimental
values of around 16% and 28% considering the as-designed
strut thickness in case of auxetic FGPSs with θ = 15° and
25°, respectively. A refined analysis using the as-printed
values defined by µ-CT scan permits to obtain a value
very close to the experimental one in the case of θ = 15°.
This does not happen in the case of auxetic structures
with θ = 25° where the value becomes 24% smaller than
the experimental one. To shed light on this unexpected
discrepancy, the effective Gibson-Ashby constants for both
auxetic structures were defined, as shown in Figure 16,
and based on the nominal values of relative density and
strut thickness. Since the bending-dominated nature of
the auxetic unit cell, addition of the theoretical curves in
case of a pure bending-dominated behavior (C = 1 and Figure 16. Log-log plot of the Gibson-Ashby model for Young’s modulus
1
n = 2 [48,56,57] ) is shown in Figure 16. The plots permit to for both auxetic structures and comparison with a pure bending-
1
obtain C = 0.41 and 0.75 and n = 1.95 and 3.10 for the dominated behavior.
1
1
auxetic structure with θ = 15° and θ = 25°, respectively.
The R in case auxetic with θ = 25° is quite small (0.86) and
2
it is justified considering the loss of the auxetic geometry
in the case of the higher relative density that impairs the
applicability of the adopted homogenization method. To
overcome this limitation, a fully solid finite element model
could be developed, but due to its low computational
efficiency, it is not proposed in this analysis. A slope quite
close to the pure bending-dominated behavior is observed
in the case of auxetic with θ = 15°. Differently, considering
θ = 25°, higher slope is detected. Nevertheless, this value
is affected by excessive streamlining obtained by using
homogenization method in the high density level where
the loss of auxetic structure occurs. Neglecting the elastic
modulus of the specimen portion with 0.75 relative density,
the slope becomes equal to 1.94, which is very close to the
one expected for a pure bending-dominated behavior. This
important result reveals that the relative porosity cannot Figure 17. Elastic modulus of the auxetic functionally graded porous
exceed a certain threshold for the metamaterial to display structures defined by means of homogenization method and Equation III
its microarchitecture-dependent properties. considering the Ti-21S and the Ti-6Al-4V alloys
Volume 9 Issue 4 (2023) 461 https://doi.org/10.18063/ijb.728