
Page 465 - IJB-9-4
P. 465
International Journal of Bioprinting β-Ti21S auxetic FGPs produced by laser powder bed fusion
Table 4. Summary of 3D metrological characterization of the auxetic FGPS with θ = 15° and 25° for the different density relative
levels
Auxetic Strut thickness Pore size
θ (°) ρ CAD (‑) CAD (mm) µ‑CT (mm) Deviation to CAD (%) CAD (mm) µ‑CT (mm) Deviation to CAD (%)
r
15 0.34 1.17±0.02 1.01±0.04 −14±5 1.12±0.47 0.98±0.38 −13±71
0.49 1.47±0.03 1.34±0.08 −9±7 0.98±0.39 0.79±0.33 −19±66
0.66 1.78±0.10 1.61±0.23 −10±18 0.78±0.32 0.69±0.28 −12±72
25 0.40 1.20±0.02 0.94±0.06 −22±6 1.00±0.40 0.85±0.37 −15±71
0.58 1.51±0.06 1.24±0.11 −18±11 0.81±0.31 0.73±0.32 −10±74
0.75 1.80±0.24 1.44±0.16 −20±20 0.63±0.27 0.62±0.28 −2±87
FGPS: Functionally graded porous structures, CAD: Computer-aided design
A B
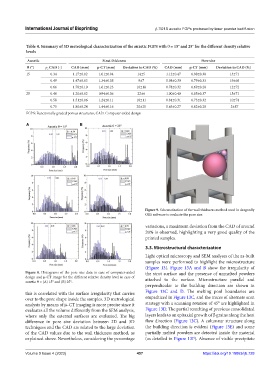
Figure 9. Schematization of the wall thickness method used in dragonfly
ORS software to evaluate the pore size.
variations, a maximum deviation from the CAD of around
20% is observed, highlighting a very good quality of the
printed samples.
3.3. Microstructural characterization
Light optical microscopy and SEM analyses of the as-built
samples were performed to highlight the microstructure
(Figure 13). Figure 13A and B show the irregularity of
Figure 8. Histograms of the pore size data in case of computer-aided the strut surface and the presence of unmelted powders
design and µ-CT image for the different relative density level in case of attached to the surface. Microstructure parallel and
auxetic θ = (A) 15° and (B) 25°.
perpendicular to the building direction are shown in
this is correlated with the surface irregularity that carries Figure 13C and D. The melting pool boundaries are
over to the pore shape inside the samples. 3D metrological empathized in Figure 13C, and the traces of alternate scan
analysis by means of µ-CT imaging is more precise since it strategy with a scanning rotation of 45° are highlighted in
evaluates all the volume differently from the SEM analysis, Figure 13D. The partial remelting of previous consolidated
where only the external surfaces are evaluated. The big layers leads to an epitaxial growth of β grains along the heat
difference in pore size deviation between 2D and 3D flow direction (Figure 13C). A columnar structure along
techniques and the CAD are related to the large deviation the building direction is evident (Figure 13E) and some
of the CAD values due to the wall thickness method, as partially melted powders are detected inside the material
explained above. Nevertheless, considering the percentage (as detailed in Figure 13F). Absence of visible precipitate
Volume 9 Issue 4 (2023) 457 https://doi.org/10.18063/ijb.728