
Page 539 - IJB-9-6
P. 539
International Journal of Bioprinting High-performance SrCS scaffolds via vat photopolymerization
(shown in Figure 6f–h). With increasing BTA content to Figure 8a shows the stress–strain behaviors of the
40 wt.% (SrCS-40BTA), the maximum densification rate prepared SrCS scaffolds. The stress–strain curves revealed
further increased to 0.59 s , while the corresponding that the SrCS scaffolds possessed two stages of elastic
−1
temperature was kept at 1176°C (Figure 6i). After sintering deformation and brittle fracture. With the increase
at 1175°C for 2 h, the shrinkage rate of the SrCS-40BTA of strain, brittle fractures occurred in the thin bars of
scaffold was further reduced (shown scaffolds, and the stress value fluctuated up and down
in Figure 6j–l). during compression, resulting in a zigzag curve. When the
scaffolds were completely broken, the compressive strength
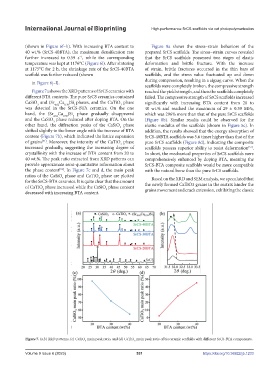
Figure 7a shows the XRD patterns of SrCS ceramics with reached the yield strength, and then the scaffolds completely
different BTA contents. The pure SrCS ceramics contained failed. The compressive strength of SrCS scaffolds increased
CaSiO and (Sr Ca )Si phases, and the CaTiO phase significantly with increasing BTA content from 20 to
0.38
4.62
3
3
3
was detected in the SrCS-BTA ceramics. On the one 40 wt.% and reached the maximum of 29 ± 0.39 MPa,
hand, the (Sr Ca )Si phase gradually disappeared which was 296% more than that of the pure SrCS scaffolds
3
4.62
0.38
and the CaSiO phase reduced after doping BTA. On the (Figure 8b). Similar results could be observed for the
3
other hand, the diffraction peaks of the CaSiO phase elastic modulus of the scaffolds (shown in Figure 8c). In
3
shifted slightly to the lower angle with the increase of BTA addition, the results showed that the energy absorption of
content (Figure 7b), which indicated the lattice expansion SrCS-40BTA scaffolds was 5.6 times higher than that of the
of grains . Moreover, the intensity of the CaTiO phase pure SrCS scaffolds (Figure 8d), indicating the composite
[51]
3
increased gradually, suggesting the increasing degree of scaffolds possess superior ability to resist deformation .
[53]
crystallinity with the increase of BTA content from 20 to In short, the mechanical properties of SrCS scaffolds were
40 wt.%. The peak ratio extracted from XRD patterns can comprehensively enhanced by doping BTA, meaning the
provide approximate semi-quantitative information about SrCS-BTA composite scaffolds would be more compatible
the phase content . In Figure 7c and d, the main peak with the natural bone than the pure SrCS scaffolds.
[52]
ratios of the CaSiO phase and CaTiO phase are plotted Based on the XRD and SEM analysis, we speculated that
3
3
for the SrCS-BTA ceramics. It is quite clear that the amount the newly formed CaTiO3 grains in the matrix hinder the
of CaTiO phase increased while the CaSiO phase content grains movement and crack extension, exhibiting the classic
3
3
decreased with increasing BTA content.
Figure 7. (a,b) XRD patterns, (c) CaSiO main peak ratio, and (d) CaTiO main peak ratio of bioceramic scaffolds with different SrCS-BTA components.
3 3
Volume 9 Issue 6 (2023) 531 https://doi.org/10.36922/ijb.1233