
Page 315 - v11i4
P. 315
International Journal of Bioprinting 3D scaffold prevents tendon ossification
models were established via mid-tendon transection in respectively. The SF–HPC group exhibited a significantly
rats (Figure 7E). Following transection, rats in the control smaller HO volume compared to both the control and SF
group received no intervention beyond layered closure of groups (Figure 7A2–C2, D). At 8 weeks post-operatively,
fascia and skin. Rats implanted with SF scaffolds at the HO volumes increased to approximately 4.6 mm in the
3
injury site were designated as the SF group, while those control group and 2.4 mm in the SF group, whereas the
3
receiving SF–HPC scaffolds comprised the SF–HPC group. SF–HPC group maintained minimal HO (0.5 mm ). The
3
At 2, 4, and 8 weeks post-operatively, micro-CT scans were SF–HPC group consistently demonstrated significantly
performed on all groups to quantify HO volume at the reduced HO volume compared to the other two groups at
injury site. At 8 weeks, the skin and subcutaneous fascia this time point (Figure 7A3–C3, D).
overlying the Achilles tendon were surgically exposed for Gross examination and histological staining of rat
gross morphological evaluation. Tendon specimens were Achilles tendons at 8 weeks post-operatively revealed that,
subsequently harvested for histological analyses, including in the control group, evident HO tissue was present at
H&E staining, Safranin O staining, and IHC staining. both the proximal and distal insertion sites of the tendon,
Micro-CT results revealed no significant HO tissue accompanied by inflammatory hyperplasia and scar tissue
at the Achilles tendon site in any group at 2 weeks post- formation (Figure 7A4). The SF group exhibited minimal
operatively (Figure 7A1–C1). By 4 weeks, HO tissue HO tissue at the insertion sites, with sporadic scar tissue
volumes of approximately 2.1 mm , 1.7 mm , and 0.2 mm and irregular tendon morphology (Figure 7B4). In contrast,
3
3
3
were observed in the control, SF, and SF–HPC groups, the SF–HPC group displayed no grossly visible HO tissue,
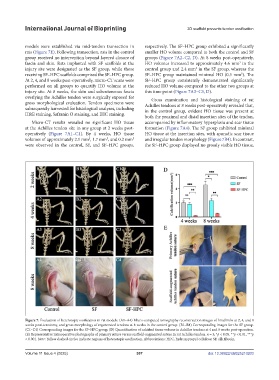
Figure 7. Evaluation of heterotopic ossification in rat models. (A1–A4) Micro-computed tomography reconstruction images of hindlimbs at 2, 4, and 8
weeks post-tenotomy, and gross morphology of regenerated tendons at 8 weeks in the control group. (B1–B4) Corresponding images for the SF group.
(C1–C4) Corresponding images for the SF–HPC group. (D) Quantification of calcified tissue volume in Achilles tendons at 4 and 8 weeks post-operation.
(E) Representative intraoperative photographs of primary suture versus scaffold-augmented suture in rat Achilles tendon. n = 3; *p < 0.05, **p < 0.01, ***p
< 0.001. Note: Yellow dashed circles indicate regions of heterotopic ossification. Abbreviations: HPC, hydroxypropyl cellulose; SF, silk fibroin.
Volume 11 Issue 4 (2025) 307 doi: 10.36922/IJB025210203