
Page 60 - IJOCTA-15-4
P. 60
MN. Khan et.al. / IJOCTA, Vol.15, No.4, pp.594-609 (2025)
8
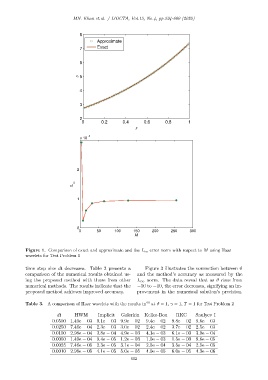
Approximate
7 Exact
6
5 s
4
3
2
0 0.2 0.4 0.6 0.8 1
x
−4
x 10
2
L ∞
1
0
0 50 100 150 200 250 300
M
Figure 1. Comparison of exact and approximate and the L ∞ error norm with respect to M using Haar
wavelets for Test Problem 1
time step size dt decreases. Table 2 presents a Figure 3 illustrates the connection between ϑ
comparison of the numerical results obtained us- and the method’s accuracy as measured by the
ing the proposed method with those from other L ∞ norm. The data reveal that as ϑ rises from
numerical methods. The results indicate that the −50 to −10, the error decreases, signifying an im-
proposed method achieves improved accuracy. provement in the numerical solution’s precision.
Table 3. A comparison of Haar wavelets with the results in 40 at ϑ = 1, γ = 1, T = 1 for Test Problem 2
dt HWM Implicit Galerkin Keller-Box RKC Saulyev I
0.0500 1.49e − 03 9.1e − 03 9.9e − 02 9.4e − 02 9.8e − 02 9.6e − 03
0.0250 7.46e − 04 2.3e − 03 3.0e − 02 2.4e − 02 3.7e − 02 2.5e − 03
0.0100 2.98e − 04 3.8e − 04 4.9e − 03 4.1e − 03 6.1e − 03 3.9e − 04
0.0050 1.49e − 04 9.4e − 05 1.2e − 03 1.0e − 03 1.5e − 03 9.6e − 05
0.0025 7.46e − 05 2.3e − 05 3.1e − 04 2.5e − 04 3.5e − 04 2.5e − 05
0.0010 2.98e − 05 4.1e − 05 5.0e − 05 4.0e − 05 6.0e − 05 4.3e − 06
602