
Page 99 - IJOCTA-15-4
P. 99
Advanced frequency control strategy for power systems with high renewable energy penetration
Figure 14. Frequency response at bus 25 of Scenario 2
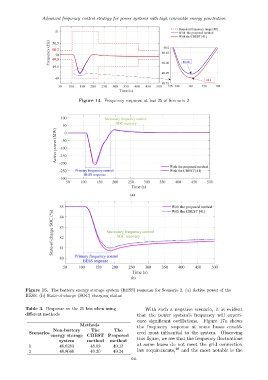
Figure 15. The battery energy storage system (BESS) response for Scenario 2. (a) Active power of the
BESS. (b) State-of-charge (SOC) charging status
Table 3. Response on the 25 bus when using With such a negative scenario, it is evident
different methods that the power system’s frequency will experi-
ence significant oscillations. Figure 17a shows
Methods
the frequency response at some buses consid-
Non-battery The The
Scenarios ered most influential to the system. Observing
energy storage CBEST Proposed this figure, we see that the frequency fluctuations
system method method
1 48.6283 48.09 49.13 at some buses do not meet the grid connection
40
2 48.8046 49.20 49.24 law requirements, and the most notable is the
641