
Page 94 - IJOCTA-15-4
P. 94
Viet Thanh et al. / IJOCTA, Vol.15, No.4, pp.625-648 (2025)
Table 1. Power distribution of the generating sources in the modified IEEE 39-bus system
Buses 2 6 10 19 20 22 23 25 29 39
Name PV3 G2 G3 G4 G5 G6 WT1 PV2 PV1 G1
Generators
Power (MW) 250 527 650 632 254 650 600 1200 600 1000
P
The total generating capacity of the system: P sys (MW) 6363
P
The total generating capacity of PV and WT: P PV +WT (MW) 2650
P 38
The total load of the system P load (MW) 6097
P
The proportion of renewable energy sources connected to the system P × 100% 41.65%
P PV+WT
P sys
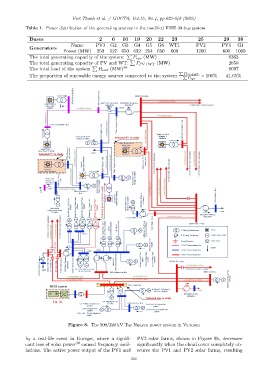
Figure 8. The 500/220 kV Tay Nguyen power system in Vietnam
by a real-life event in Europe, where a signifi- PV2 solar farms, shown in Figure 9b, decreases
cant loss of solar power 39 caused frequency oscil- significantly when the cloud cover completely ob-
lations. The active power output of the PV1 and scures the PV1 and PV2 solar farms, resulting
636