
Page 98 - IJOCTA-15-4
P. 98
Viet Thanh et al. / IJOCTA, Vol.15, No.4, pp.625-648 (2025)
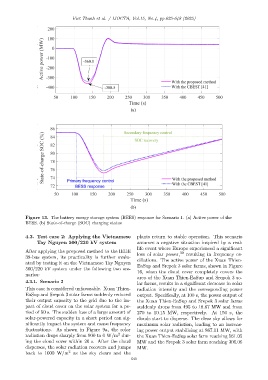
Figure 13. The battery energy storage system (BEES) response for Scenario 1. (a) Active power of the
BESS. (b) State-of-charge (SOC) charging status
4.3. Test case 2: Applying the Vietnamese plants return to stable operation. This scenario
Tay Nguyen 500/220 kV system assumes a negative situation inspired by a real-
life event where Europe experienced a significant
After applying the proposed method to the IEEE 39
loss of solar power, resulting in frequency os-
39-bus system, its practicality is further evalu-
cillations. The active power of the Xuan Thien-
ated by testing it on the Vietnamese Tay Nguyen
EaSup and Srepok 3 solar farms, shown in Figure
500/220 kV system under the following two sce-
16, when the cloud cover completely covers the
narios:
area of the Xuan Thien-EaSup and Srepok 3 so-
4.3.1. Scenario 3
lar farms, results in a significant decrease in solar
This case is considered unfavorable. Xuan Thien- radiation intensity and the corresponding power
EaSup and Srepok 3 solar farms suddenly reduced output. Specifically, at 100 s, the power output of
their output capacity to the grid due to the im- the Xuan Thien-EaSup and Srepok 3 solar farms
pact of cloud cover on the solar system for a pe- suddenly drops from 495 to 18.67 MW and from
riod of 50 s. The sudden loss of a large amount of 270 to 10.15 MW, respectively. At 150 s, the
solar-powered capacity in a short period can sig- clouds start to disperse. The clear sky allows for
nificantly impact the system and cause frequency maximum solar radiation, leading to an increas-
fluctuations. As shown in Figure 9a, the solar ing power output stabilizing at 867.11 MW, with
2
radiation drops sharply from 900 to 0 W/m dur- the Xuan Thien-EaSup solar farm reaching 561.05
ing the cloud cover within 20 s. After the cloud MW and the Srepok 3 solar farm reaching 306.06
disperses, the solar radiation recovers and jumps MW.
2
back to 1000 W/m as the sky clears and the
640