
Page 96 - IJOCTA-15-4
P. 96
Viet Thanh et al. / IJOCTA, Vol.15, No.4, pp.625-648 (2025)
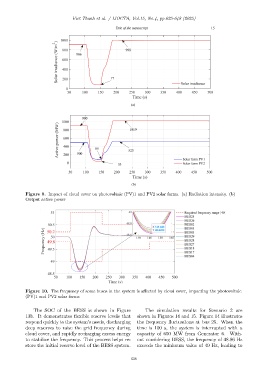
Figure 9. Impact of cloud cover on photovoltaic (PV)1 and PV2 solar farms. (a) Radiation intensity. (b)
Output active power
Figure 10. The frequency of some buses in the system is affected by cloud cover, impacting the photovoltaic
(PV)1 and PV2 solar farms
The SOC of the BESS is shown in Figure The simulation results for Scenario 2 are
13b. It demonstrates flexible reserve levels that shown in Figures 14 and 15. Figure 14 illustrates
respond quickly to the system’s needs, discharging the frequency fluctuations at bus 25. When the
deep reserves to raise the grid frequency during time is 100 s, the system is interrupted with a
cloud cover, and rapidly recharging excess energy capacity of 650 MW from Generator 6. With-
to stabilize the frequency. This process helps re- out considering BESS, the frequency of 48.86 Hz
store the initial reserve level of the BESS system. exceeds the minimum value of 49 Hz, leading to
638