
Page 82 - IJPS-11-6
P. 82
International Journal of
Population Studies The paradox of urban decline in India
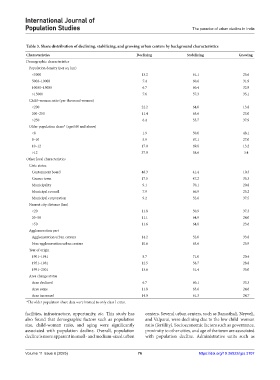
Table 3. Share distribution of declining, stabilizing, and growing urban centers by background characteristics
Characteristics Declining Stabilizing Growing
Demographic characteristics
Population density (per sq. km)
<5000 13.2 61.1 25.6
5000–10000 7.4 60.6 31.9
10000–15000 6.7 60.4 32.9
>15000 7.6 57.3 35.1
Child–woman ratio (per thousand women)
<200 22.2 64.0 13.8
200–250 11.4 65.6 23.0
>250 6.4 55.7 37.9
Older population share* (aged 60 and above)
<8 1.9 50.0 48.1
8–10 5.9 67.1 27.0
10–12 17.0 69.8 13.2
>12 37.9 58.6 3.4
Other local characteristics
Civic status
Cantonment board 48.3 41.4 10.3
Census town 17.5 47.2 35.3
Municipality 9.1 70.1 20.8
Municipal council 7.9 66.9 25.2
Municipal corporation 9.2 52.6 37.5
Nearest city distance (km)
<20 11.8 50.9 37.3
20–50 11.1 64.9 24.0
>50 11.6 64.8 23.6
Agglomeration part
Agglomeration urban centers 14.2 52.0 33.8
Non-agglomeration urban centers 10.6 63.6 25.9
Year of origin
1901–1941 8.7 71.0 20.4
1951–1981 12.5 58.7 28.8
1991–2001 13.6 51.4 35.0
Area change status
Area declined 6.7 60.1 33.3
Area same 11.8 63.6 24.6
Area increased 14.0 61.3 24.7
*The older population share data were limited to only class I cities.
facilities, infrastructure, opportunity, etc. This study has centers. Several urban centers, such as Banasthali, Neyveli,
also found that demographic factors such as population and Valparai, were declining due to the low child–woman
size, child-woman ratio, and aging were significantly ratio (fertility). Socioeconomic factors such as governance,
associated with population decline. Overall, population proximity to other cities, and age of the town are associated
decline is more apparent in small- and medium-sized urban with population decline. Administrative units such as
Volume 11 Issue 6 (2025) 76 https://doi.org/10.36922/ijps.3107