
Page 83 - IJPS-11-6
P. 83
International Journal of
Population Studies The paradox of urban decline in India
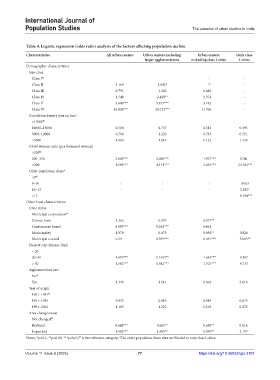
Table 4. Logistic regression (odds ratio) analysis of the factors affecting population decline
Characteristics All urban centers Urban centers excluding Urban centers Only class
larger agglomerations excluding class I cities I cities
Demographic characteristics
Size-class
Class I ® - -
Class II 1.169 1.842* -® -
Class III 0.791 1.262 0.686 -
Class IV 1.548 2.489** 1.371 -
Class V 3.606*** 5.817*** 3.182 -
Class VI 15.836*** 24.732*** 13.706 -
Population density (per sq. km)
>15000 ®
10000–15000 0.568 0.737 0.543 0.495
5000–10000 0.706 1.226 0.753 0.551
<5000 1.065 1.615 1.122 1.139
Child-woman ratio (per thousand women)
>250 ®
200–250 2.005*** 2.080*** 1.977*** 5.786
<200 4.592*** 4.471*** 4.054*** 24.703***
Older population share a
<8 ®
8–10 - - - 0.953
10–12 - - - 2.392*
>12 - - - 9.104***
Other local characteristics
Civic status
Municipal corporation ®
Census town 1.362 0.937 0.074**
Cantonment board 8.859*** 5.363*** 0.461
Municipality 1.079 0.675 0.058** 0.826
Municipal council 0.59 0.397*** 0.031*** 3.085**
Nearest city distance (km)
< 20
20–50 1.479*** 1.519*** 1.643*** 0.297
> 50 1.562*** 1.582*** 1.701*** 0.733
Agglomeration part
No ®
Yes 1.376 1.514 1.364 2.018
Year of origin
1901–1941 ®
1951–1981 0.933 0.916 0.949 0.675
1991–2001 1.185 1.222 1.219 0.872
Area change status
Not changed ®
Reduced 0.668*** 0.662** 0.658** 0.514
Expanded 1.482*** 1.405** 1.395** 2.157
a
®
Notes: *p≤0.1; **p≤0.05; ***p≤0.01; is the reference category; The older population share data are limited to only class I cities.
Volume 11 Issue 6 (2025) 77 https://doi.org/10.36922/ijps.3107