
Page 15 - ITPS-6-1
P. 15
Vishwakarma, et al.
9 INNOSC Theranostics and Pharmacological Sciences, 2023, Vol. 6, No. 1 Administration of AEPO to diabetic rats caused
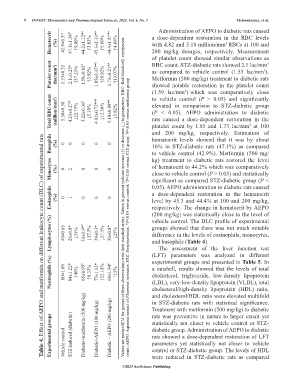
Hematocrit (%) 42.9±0.37 47.1±1.38* ↑9.80% 44.2±1.12* # ↑3.03% 45.3±1.33* # ↑5.60% 44.4±1.87* # ↑4.66% a dose-dependent restoration in the RBC levels
with 4.82 and 5.18 million/mm RBCs at 100 and
3
200 mg/kg dosages, respectively. Measurement
of platelet count showed similar observations as
Platelet count (lac/mm 3 ) 1.53±0.32 2.1±0.25* ↑37.25% 1.59±0.82 # ↑3.92% 1.85±0.35* #$ ↑20.92% 1.73±0.21* # ↑13.07% as compared to vehicle control (1.53 lac/mm ).
RBC count. STZ-diabetic rats showed 2.1 lac/mm
3
3
Metformin (500 mg/kg) treatment to diabetic rats
count; AEPO: Aqueous extract of Pleurotus ostreatus; STZ: Streptozotocin. *P<0.05 versus control; # P<0.05 versus STZ group; $ P<0.05 versus metformin group
showed notable restoration in the platelet count
(1.59 lac/mm ) which was comparatively close
3
Total RBC count (million/mm 3 ) 5.50±0.58 4.25±0.27* ↓22.73% 5.22±0.36 # ↓5.10% 4.82±0.72* #$ ↓12.36% 5.18±0.89* # ↓5.82% elevated in comparison to STZ-diabetic group
to vehicle control (P > 0.05) and significantly
(P < 0.05). AEPO administration to diabetic
rats caused a dose-dependent restoration in the
platelet count by 1.85 and 1.73 lac/mm at 100
3
and 200 mg/kg, respectively. Estimation of
Basophils (%) 0 0 0 0 0 hematocrit levels showed that it was by about
Table 4. Effect of AEPO and metformin on different leukocyte count (DLC) of experimental rats
10% in STZ-diabetic rats (47.1%) as compared
to vehicle control (42.9%). Metformin (500 mg/
Monocytes (%) 0 2 0 0 0 kg) treatment to diabetic rats restored the level
of hematocrit to 44.2% which was comparatively
close to vehicle control (P > 0.05) and statistically
significant as compared STZ-diabetic group (P <
Eosinophils (%) 0 1 0 0 0 Values are mean±SEM for groups of three observations with their standard errors. Values in percent indicate increase (↑) or decrease (↓) in parameters. RBC: Red blood cell, erythrocyte 0.05). AEPO administration to diabetic rats caused
a dose-dependent restoration in the hematocrit
level by 45.3 and 44.4% at 100 and 200 mg/kg,
respectively. The change in hematocrit by AEPO
(200 mg/kg) was statistically close to the level of
Lymphocytes (%) 40±0.65 26±0.8* ↓35% 33±1.9* # ↓17.5% 29±0.3* ↓27.5% 30±0.8* ↓25% groups showed that there was not much notable
vehicle control. The DLC profile of experimental
difference in the levels of eosinophils, monocytes,
and basophils (Table 4).
The assessment of the liver function test
(LFT) parameters was analyzed in different
Neutrophils (%) 60±1.09 84±1.22* ↑40% 65±0.95 # ↑8.33% 77±1.32* ↑22.18% 69±1.94 # ↑15% a nutshell, results showed that the levels of total
experimental groups and presented in Table 5. In
cholesterol, triglyceride, low-density lipoprotein
(LDL), very-low-density lipoprotein (VLDL), total
cholesterol/high-density lipoprotein (HDL) ratio,
and cholesterol/HDL ratio were elevated multifold
in STZ-diabetic rats with statistical significance.
rats was preventive in nature to larger extent yet
Experimental groups Vehicle control STZ-induced (diabetic) Diabetic+metformin (500 mg/kg) Diabetic+AEPO (100 mg/kg) Diabetic + AEPO (200 mg/kg) Treatment with metformin (500 mg/kg) to diabetic
statistically not closer to vehicle control or STZ-
diabetic group. Administration of AEPO to diabetic
rats showed a dose-dependent restoration of LFT
parameters yet statistically not closer to vehicle
control or STZ-diabetic group. The levels of HDL
were reduced in STZ-diabetic rats as compared
©2023 AccScience Publishing