
Page 12 - ITPS-6-1
P. 12
6 INNOSC Theranostics and Pharmacological Sciences, 2023, Vol. 6, No. 1 Vishwakarma, et al.
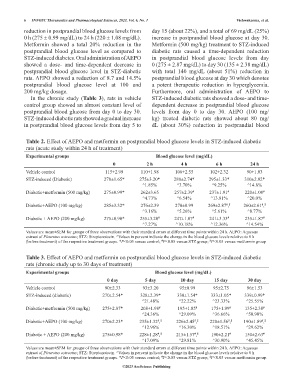
reduction in postprandial blood glucose levels from day 15 (about 22%), and a total of 69 mg/dL (25%)
0 h (275 ± 0.99 mg/dL) to 24 h (220 ± 1.08 mg/dL). increase in postprandial blood glucose at day 30.
Metformin showed a total 20% reduction in the Metformin (500 mg/kg) treatment to STZ-induced
postprandial blood glucose level as compared to diabetic rats caused a time-dependent reduction
STZ-induced diabetes. Oral administration of AEPO in postprandial blood glucose levels from day
showed a dose- and time-dependent decrease in 0 (275 ± 2.87 mg/dL) to day 30 (135 ± 2.38 mg/dL)
postprandial blood glucose level in STZ-diabetic with total 140 mg/dL (about 51%) reduction in
rats. AEPO showed a reduction of 8.7 and 14.5% postprandial blood glucose at day 30 which denotes
postprandial blood glucose level at 100 and a potent therapeutic reduction in hyperglycemia.
200 mg/kg dosage. Furthermore, oral administration of AEPO to
In the chronic study (Table 3), rats in vehicle STZ-induced diabetic rats showed a dose- and time-
control group showed an almost constant level of dependent decrease in postprandial blood glucose
postprandial blood glucose from day 0 to day 30. levels from day 0 to day 30. AEPO (100 mg/
STZ-induced diabetic rats showed a gradual increase kg) treated diabetic rats showed about 80 mg/
in postprandial blood glucose levels from day 5 to dL (about 30%) reduction in postprandial blood
Table 2. Effect of AEPO and metformin on postprandial blood glucose levels in STZ-induced diabetic
rats (acute study within 24 h of treatment)
Experimental groups Blood glucose level (mg/dL)
0 2 h 4 h 6 h 24 h
Vehicle control 115±2.99 110±1.98 106±2.55 102±2.32 90±1.03
STZ-induced (Diabetic) 270±1.65* 275±3.20* 280±2.74* 295±1.33* 310±2.92*
^1.85% ^3.70% ^9.25% ^14.8%
Diabetic+metformin (500 mg/kg) 275±0.99* 262±3.65 257±2.39 237±1.91 220±1.08
#
#
#
^4.73% ^6.54% ^13.81% ^20.0%
Diabetic+AEPO (100 mg/kg) 285±3.32* 276±2.39 270±0.99 269±2.87 , 260±2.61 ,
# $
# $
^3.16% ^5.26% ^5.61% ^8.77%
Diabetic + AEPO (200 mg/kg) 275±0.98* 255±3.20 247±1.87 241±3.33 235±1.87
#
#
#
#
^7.27% ^10.18% ^12.36% ^14.54%
Values are mean±SEM for groups of three observations with their standard errors at different time points within 24 h. AEPO: Aqueous
extract of Pleurotus ostreatus; STZ: Streptozotocin. ^Values in percent indicate the change in the blood glucose levels relative to 0 h
(before treatment) of the respective treatment groups. *P<0.05 versus control; P<0.05 versus STZ group; P<0.05 versus metformin group
#
$
Table 3. Effect of AEPO and metformin on postprandial blood glucose levels in STZ-induced diabetic
rats (chronic study up to 30 days of treatment)
Experimental groups Blood glucose level (mg/dL)
0 day 5 day 10 day 15 day 30 day
Vehicle control 90±2.33 93±3.20 95±0.99 95±2.75 96±1.53
STZ-induced (diabetic) 270±2.54* 328±2.39* 330±1.54* 333±1.05* 339±0.99*
^21.48% ^22.22% ^23.33% ^25.55%
Diabetic+metformin (500 mg/kg) 275±2.87* 208±1.98 195±1.85 175±1.99 135±2.38
#
#
#
#
^24.36% ^29.09% ^36.66% ^50.90%
Diabetic+AEPO (100 mg/kg) 270±2.23* 235±1.32 , 226±2.45 , 220±1.56 , 190±1.89 ,
# $
# $
# $
# $
^12.96% ^16.30% ^18.51% ^29.62%
Diabetic + AEPO (200 mg/kg) 275±0.98* 228±1.28 , 215±1.57 , 190±2.21 150±2.63
#
#
# $
# $
^17.09% ^29.81% ^30.90% ^45.45%
Values are mean±SEM for groups of three observations with their standard errors at different time points within 24 h. AEPO: Aqueous
extract of Pleurotus ostreatus; STZ: Streptozotocin. ^Values in percent indicate the change in the blood glucose levels relative to 0 h
(before treatment) of the respective treatment groups. *P<0.05 versus control; P<0.05 versus STZ group; P<0.05 versus metformin group.
#
$
©2023 AccScience Publishing