
Page 122 - JCAU-7-3
P. 122
Journal of Chinese
Architecture and Urbanism Spatial analysis of urban garden space
cover classification has been extensively studied, providing NNET-based approaches enable various applications,
valuable insights into its effective application in remote such as monitoring forest fires, estimating burned areas,
sensing. Due to its strong generalization ability and resistance and identifying land use patterns. The increasing adoption
to overfitting, RF remains one of the most widely used and of NNETs in satellite image classification highlights their
reliable classifiers in land use and land cover studies. potential to address a wide range of remote sensing
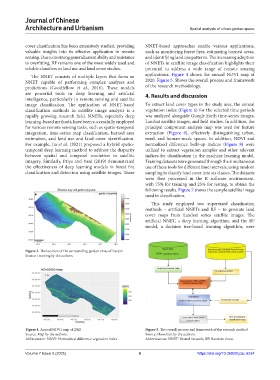
The NNET consists of multiple layers that form an applications. Figure 4 shows the annual NDVI map of
NNET capable of performing complex analyses and 2020. Figure 5. Shows the overall process and framework
predictions (Goodfellow et al., 2016). These models of the research methodology.
are powerful tools in deep learning and artificial 4. Results and discussion
intelligence, particularly in remote sensing and satellite
image classification. The application of NNET-based To extract land cover types in the study area, the annual
classification methods in satellite image analysis is a vegetation index (Figure 6) for the selected time periods
rapidly growing research field. NNETs, especially deep was analyzed alongside Google Earth time-series images,
learning-based methods, have been successfully employed Landsat satellite images, and field studies. In addition, the
for various remote sensing tasks, such as spatio-temporal principal component analysis map was used for feature
integration, time-series map classification, burned area extraction (Figure 9), effectively distinguishing urban,
estimation, and land use and land cover identification. rural, and human-made spaces. In addition, NDVI and
For example, Jia et al. (2021) proposed a hybrid spatio- normalized difference built-up indices (Figure 8) were
temporal deep learning method to address the disparity utilized to extract vegetation samples and other relevant
between spatial and temporal resolution in satellite indices for classification in the machine learning model.
imagery. Similarly, Priya and Vani (2019) demonstrated Training datasets were generated through the simultaneous
the effectiveness of deep learning models in forest fire use of these tools for different time intervals, using random
classification and detection using satellite images. These sampling to classify land cover into six classes. The datasets
were then processed in the R software environment,
with 75% for training and 25% for testing, to obtain the
following results. Figure 7 shows the sample satellite image
used in classification.
This study employed two supervised classification
methods – artificial NNETs and RF – to generate land
cover maps from Landsat series satellite images. The
artificial NNET, a deep learning algorithm, and the RF
model, a decision tree-based learning algorithm, were
Figure 3. The location of the surrounding garden cities of Zanjan
Source: Drawing by the authors.
Figure 4. Annual NDVI map of 2020 Figure 5. The overall process and framework of the research method
Source: Map by the authors. Source: Flowchart by the authors.
Abbreviation: NDVI: Normalized difference vegetation index. Abbreviations: NNET: Neural network; RF: Random forest.
Volume 7 Issue 3 (2025) 6 https://doi.org/10.36922/jcau.6234