
Page 126 - JCAU-7-3
P. 126
Journal of Chinese
Architecture and Urbanism Spatial analysis of urban garden space
and a reduction in desertification. The decrease in barren Land change modeler is a specialized tool designed for
lands from 228,000 sqkm in 2000 to 64,000 sqkm in 2020 land use planning. It utilizes historical land cover changes
highlights a significant positive environmental change. as input data to model potential future change scenarios.
In addition, the significant increase in shrublands from The land change modeler empirically analyzes the
292,000 sqkm in 2000 to 362,000 sqkm in 2020 further relationship between land cover changes and the variables
supports the conclusion that vegetation cover in the study influencing them. By providing a systematic approach,
area has improved (Figure 12). The increasing trend of this tool enables the prediction and mapping of future
grasslands, which include annual plants and grasses, along land cover changes (Eastman & Toledano, 2018). In this
with pastures, may indicate crop expansion in parts of the research, TerrSet software was used to analyze land cover
Zanjan river plain. changes over 5 time periods in a time-series framework.
The calculated land cover changes were examined to
assess spatial patterns and trends in land use dynamics.
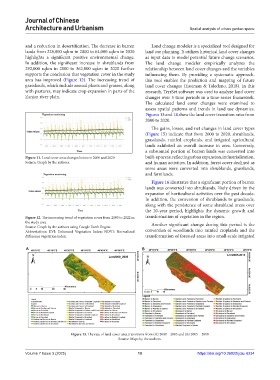
Figures 13 and 14 show the land cover transition rates from
2000 to 2020.
The gains, losses, and net changes in land cover types
(Figure 15) indicate that from 2000 to 2020, shrublands,
grasslands, rainfed croplands, and irrigated agricultural
lands exhibited an overall increase in area. Conversely,
a substantial portion of barren lands was converted into
Figure 11. Land cover area changes between 2000 and 2020 built-up areas, reflecting urban expansion, industrialization,
Source: Graph by the authors. and human activities. In addition, forest cover declined as
some areas were converted into shrublands, grasslands,
and farmlands.
Figure 16 illustrates that a significant portion of barren
lands was converted into shrublands, likely driven by the
expansion of horticultural activities over the past decade.
In addition, the conversion of shrublands to grasslands,
along with the persistence of some shrubland areas over
the 20-year period, highlights the dynamic growth and
Figure 12. The increasing trend of vegetation cover from 2000 to 2022 in transformation of vegetation in the region.
the study area Another significant change during this period is the
Source: Graph by the authors using Google Earth Engine.
Abbreviations: EVI: Enhanced Vegetation Index; NDVI: Normalized conversion of woodlands into rainfed croplands and the
difference vegetation index. transformation of forested areas into small-scale irrigated
A B
Figure 13. The rate of land cover area transitions from (A) 2000 – 2005 and (B) 2005 – 2010
Source: Maps by the authors.
Volume 7 Issue 3 (2025) 10 https://doi.org/10.36922/jcau.6234