
Page 125 - JCAU-7-3
P. 125
Journal of Chinese
Architecture and Urbanism Spatial analysis of urban garden space
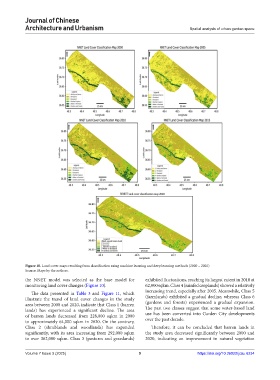
Figure 10. Land cover maps resulting from classification using machine learning and deep learning methods (2000 – 2020)
Source: Maps by the authors.
the NNET model was selected as the base model for exhibited fluctuations, reaching its largest extent in 2010 at
monitoring land cover changes (Figure 10). 62,000 sqkm. Class 4 (rainfed croplands) showed a relatively
The data presented in Table 3 and Figure 11, which increasing trend, especially after 2005. Meanwhile, Class 5
illustrate the trend of land cover changes in the study (farmlands) exhibited a gradual decline, whereas Class 6
area between 2000 and 2020, indicate that Class 1 (barren (gardens and forests) experienced a gradual expansion.
lands) has experienced a significant decline. The area The past two classes suggest that some water-based land
of barren lands decreased from 228,000 sqkm in 2000 use has been converted into Garden City developments
to approximately 64,000 sqkm in 2020. On the contrary, over the past decade.
Class 2 (shrublands and woodlands) has expanded Therefore, it can be concluded that barren lands in
significantly, with its area increasing from 292,000 sqkm the study area decreased significantly between 2000 and
to over 362,000 sqkm. Class 3 (pastures and grasslands) 2020, indicating an improvement in natural vegetation
Volume 7 Issue 3 (2025) 9 https://doi.org/10.36922/jcau.6234