
Page 123 - JCAU-7-3
P. 123
Journal of Chinese
Architecture and Urbanism Spatial analysis of urban garden space
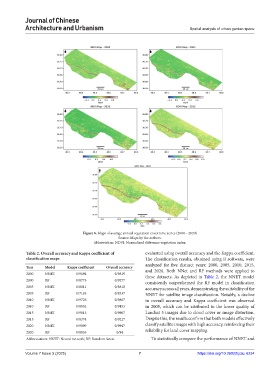
Figure 6. Maps of average annual vegetation cover time series (2000 – 2020)
Source: Maps by the authors.
Abbreviation: NDVI: Normalized difference vegetation index.
Table 2. Overall accuracy and Kappa coefficient of evaluated using overall accuracy and the Kappa coefficient.
classification maps The classification results, obtained using R software, were
analyzed for five distinct years: 2000, 2005, 2010, 2015,
Year Model Kappa coefficient Overall accuracy
2000 NNET 0/9694 0/9819 and 2020. Both NNet and RF methods were applied to
these datasets. As depicted in Table 2, the NNET model
2000 RF 0/8773 0/9277 consistently outperformed the RF model in classification
2005 NNET 0/8011 0/8818 accuracy across all years, demonstrating the suitability of the
2005 RF 0/7183 0/8337 NNET for satellite image classification. Notably, a decline
2010 NNET 0/9726 0/9867 in overall accuracy and Kappa coefficient was observed
2010 RF 0/8852 0/9453 in 2005, which can be attributed to the lower quality of
2015 NNET 0/9813 0/9907 Landsat 5 images due to cloud cover or image distortion.
2015 RF 0/8374 0/9227 Despite this, the results confirm that both models effectively
2020 NNET 0/9899 0/9947 classify satellite images with high accuracy, reinforcing their
2020 RF 0/8853 0/94 reliability for land cover mapping.
Abbreviations: NNET: Neural network; RF: Random forest. To statistically compare the performance of NNET and
Volume 7 Issue 3 (2025) 7 https://doi.org/10.36922/jcau.6234