Page 124 - JCAU-7-3
P. 124

Journal of Chinese
            Architecture and Urbanism                                             Spatial analysis of urban garden space


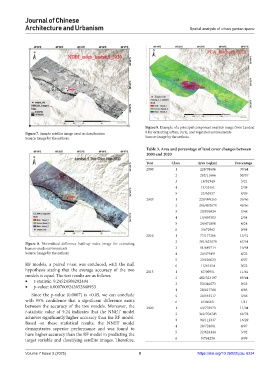
                                                               Figure 9. Example of a principal component analysis image from Landsat
            Figure 7. Sample satellite image used in classification  8 for extracting urban, rural, and vegetated environments
            Source: Image by the authors.                      Source: Image by the authors.

                                                               Table 3. Area and percentage of land cover changes between
                                                               2000 and 2020

                                                               Year       Class      Area (sqkm)     Percentage
                                                               2000         1         228/98686        39/64
                                                                            2         292/11666        50/57
                                                                            3          18/51549        3/21
                                                                            4          14/35161        2/48
                                                                            5          23/65527        4/09
                                                               2005         1         229/099265       39/66
                                                                            2         286/892978       49/66
                                                                            3         20/076934        3/48
                                                                            4         13/495503        2/34
                                                                            5         24/471896        4/24
                                                                            6          3/671962        0/64
                                                               2010         1         77/177266        13/31
            Figure  8.  Normalized difference built-up index image for extracting   2  391/633878      67/54
            human-made environments                                         3         61/689714        10/64
            Source: Image by the authors                                    4         24/479491        4/22
                                                                            5         23/626623        4/07
            RF models, a paired  t-test was conduced, with the null         6          1/261454        0/22
            hypothesis stating that the average accuracy of the two   2015  1          67/09551        11/61
            models is equal. The test results are as follows:               2         402/323197       69/64
            •   t-statistic: 9.24524508292494                               3         53/340273        9/23
            •   p-value: 0.0007609242652860933
                                                                            4         28/017788        4/85
              Since the  p-value (0.0007) is <0.05, we can conclude         5         20/545517        3/56
            with 95% confidence that a significant difference exists        6          6/386251        1/11
            between the  accuracy  of  the  two  models.  Moreover,  the   2020  1    63/778973        11/04
            t-statistic value of  9.24  indicates  that  the  NNET model    2         362/704745       62/78
            achieves significantly higher accuracy than the RF model.       3         94/112337        16/29
            Based  on  these  statistical  results,  the  NNET  model
            demonstrates superior performance and was found to              4         28/724081        4/97
            have higher accuracy than the RF model in predicting the        5         22/624144        3/92
            target variable and classifying satellite images. Therefore,    6          5/764258        0/99

            Volume 7 Issue 3 (2025)                         8                        https://doi.org/10.36922/jcau.6234
   119   120   121   122   123   124   125   126   127   128   129