
Page 48 - JCTR-10-3
P. 48
222 Das et al. | Journal of Clinical and Translational Research 2024; 10(3): 219-228
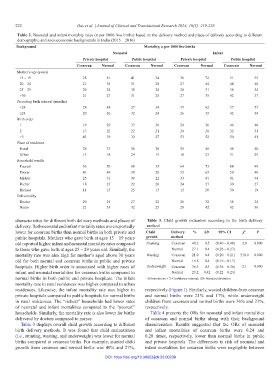
Table 2. Neonatal and infant mortality rates (n per 1000 live births) based on the delivery method and place of delivery according to different
demographic and socioeconomic backgrounds in India (2015 – 2016)
Background Mortality, n per 1000 live births
Neonatal Infant
Private hospital Public hospital Private hospital Public hospital
Cesarean Normal Cesarean Normal Cesarean Normal Cesarean Normal
Mother’s age (years)
15 – 19 28 61 41 34 36 72 51 55
20 – 24 21 35 31 28 27 44 44 40
25 – 29 20 24 30 24 26 31 38 34
>30 21 27 31 25 27 35 42 37
Preceding birth interval (months)
<24 28 48 27 34 37 62 37 53
≥24 20 26 32 24 26 33 42 34
Birth order
1 19 29 37 30 24 36 46 40
2 17 22 22 21 24 28 32 31
>3 43 39 32 27 53 52 50 41
Place of residence
Rural 28 37 36 28 35 46 48 40
Urban 13 18 24 19 18 23 31 29
Household wealth
Poorest 56 59 60 35 64 73 84 49
Poorer 41 49 38 28 53 63 50 40
Middle 25 31 30 22 33 41 41 34
Richer 18 23 22 20 24 27 30 27
Richest 11 15 25 13 15 20 30 19
Delivered by
Doctor 20 25 27 25 26 32 38 34
Nurse 21 33 32 25 28 42 42 36
characteristics for different birth delivery methods and places of Table 3. Child growth indicators according to the birth delivery
delivery. Both neonatal and infant mortality rates were reportedly method
lower for cesarean births than normal births in both private and Child Delivery % SD 95% CI χ 2 P
public hospitals. Mothers who gave birth at ages 15 – 19 years growth method
old reported higher infant and neonatal mortality rates compared Stunting Cesarean 40.2 0.5 (0.40 – 0.40) 2.0 0.000
to those who gave birth at ages 25 – 29 years old. Similarly, the Normal 27.1 0.4 (0.26 – 0.27)
mortality rate was also high for mother’s aged above 30 years Wasting Cesarean 21.0 0.4 (0.20 – 0.21) 310.0 0.000
old for both normal and cesarean births in public and private Normal 16.8 0.4 (0.16 – 0.17)
hospitals. Higher birth order is associated with higher rates of Underweight Cesarean 36.3 0.5 (0.36 – 0.36) 2.1 0.000
infant and neonatal mortalities for cesarean births compared to Normal 23.2 0.42 (0.22 – 0.23)
normal births in both public and private hospitals. The infant Abbreviations: CI: Confidence interval; SD: Standard deviation.
mortality rate in rural residences was higher compared to urban
residences. Likewise, the infant mortality rate was higher in respectively (Figure 1). Similarly, wasted children from cesarean
private hospitals compared to public hospitals for normal births and normal births were 21% and 17%, while underweight
in rural residences. The “richest” households had lower rates children from cesarean and normal births were 36% and 23%,
of neonatal and infant mortalities compared to the “poorest” respectively.
households. Similarly, the mortality rate is also lower for births Table 4 presents the ORs for neonatal and infant mortalities
delivered by doctors compared to nurses. of cesarean and normal births along with their background
Table 3 displays overall child growth according to different characteristics. Results suggested that the ORs of neonatal
birth delivery methods. It was found that child malnutrition and infant mortalities of cesarean births were 0.24 and
(i.e., stunting, wasting, and underweight) was lower for normal 0.28 times, respectively, lower than normal births in public
births compared to cesarean births. For example, stunted child and private hospitals. The differences in risk of neonatal and
growth from cesarean and normal births was 40% and 27%, infant mortalities for cesarean births were negligible between
DOI: https://doi.org/10.36922/jctr.22.00239