
Page 47 - JCTR-10-3
P. 47
Das et al. | Journal of Clinical and Translational Research 2024; 10(3): 219-228 221
growth. The life-table technique was developed to estimate birth more than 24 months after a preceding birth were more
neonatal and infant mortality rates based on birth history inclined toward cesarean section than those who had given
variables collected from the Child Mortality Census dataset. birth less than 24 months after a preceding birth. Interestingly,
Binary logistic regression models were used to identify the odds birth order was negatively correlated with cesarean section
of normal and cesarean delivery. Childbirth through cesarean and positively correlated with normal delivery. This could be
section and normal delivery were coded as 1 and 0, respectively. associated with Muslim families who prefer normal delivery
Following the collection of bivariate data, multivariate logistic over cesarean section. Cesarean sections were reportedly more
regression models were constructed for each of the dependent common in urban residences compared to rural residences
variables. The results of the regression analysis were presented as (42.0% vs. 35.5%) due to the availability and accessibility of
odds ratios (OR), along with the corresponding 95% confidence medical facilities and transportation. Household wealth plays
intervals (CIs). All statistical analyses were performed using a dominant role in determining the birth delivery method. The
STATA software (version 15.0). “richest” households would prefer cesarean birth more than
®
3. Results the “poorest” households (43.8% vs. 24.3%, respectively). The
differences between normal and cesarean births in the “richest”
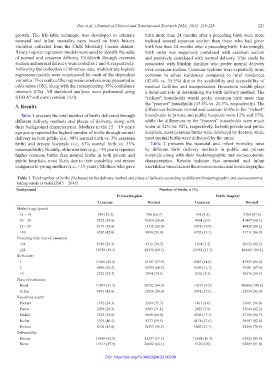
Table 1 presents the total number of births delivered through households in private and public hospitals were 12% and 57%,
different delivery methods and places of delivery, along with while the differences in the “poorest” households were much
their background characteristics. Mothers in the 15 – 19 years wider at 52% vs. 92%, respectively. In both private and public
age group reported the highest number of births through normal hospitals, most cesarean births were delivered by doctors, while
delivery in both public (i.e., 98% normal birth vs. 3% cesarean most normal births were delivered by the nurse.
birth) and private hospitals (i.e., 67% normal birth vs. 33% Table 2 presents the neonatal and infant mortality rates
cesarean birth). Notably, older mothers (e.g., >30 years) reported by different birth delivery methods in public and private
higher cesarean births than normal births in both private and hospitals along with their biodemographic and socioeconomic
public hospitals, most likely due to their capability and means characteristics. Results indicate that neonatal and infant
compared to young mothers (i.e., <19 years). Mothers who gave mortalities varied across the socioeconomic and biodemographic
Table 1. Total number of births (%) based on the delivery method and place of delivery according to different biodemographic and socioeconomic
backgrounds in India (2015 – 2016)
Background Number of births, n (%)
Private hospital Public hospital
Cesarean Normal Cesarean Normal
Mother’s age (years)
15 – 19 399 (33.3) 798 (66.7) 391 (3.4) 3764 (97.6)
20 – 24 5525 (34.6) 10424 (65.4) 4564 (9.9) 41497 (90.1)
25 – 29 8179 (38.0) 13338 (62.0) 5891 (10.8) 48428 (89.2)
>30 6585 (42.0) 9090 (58.0) 4782 (13.1) 31711 (86.9)
Preceding birth interval (months)
<24 1950 (29.3) 4712 (70.7) 1674 (7.5) 20553 (92.5)
≥24 18738 (39.3) 28938 (60.7) 13954 (11.7) 104847 (88.3)
Birth order
1 11066 (42.1) 15197 (57.9) 8067 (14.0) 47923 (86.0)
2 6899 (39.5) 10559 (60.5) 5399 (12.1) 39201 (87.9)
>3 2723 (25.7) 7894 (74.3) 2162 (5.3) 38276 (94.7)
Place of residences
Rural 11307 (35.5) 20712 (64.5) 10197 (9.2) 100062 (90.8)
Urban 9381 (42.0) 12938 (58.0) 5431 (17.6) 25338 (82.4)
Household wealth
Poorest 1102 (24.3) 3249 (75.7) 1417 (4.0) 33661 (96.0)
Poorer 2034 (28.9) 4983 (71.1) 2822 (7.8) 33546 (92.2)
Middle 3745 (36.0) 6648 (64.0) 4208 (13.3) 27386 (86.7)
Richer 5703 (40.5) 8377 (59.5) 4178 (17.6) 19597 (82.4)
Richest 8104 (43.8) 10393 (56.2) 3003 (21.1) 11210 (78.9)
Delivered by
Doctor 18509 (42.3) 25237 (57.7) 13184 (16.3) 67825 (88.9)
Nurse 11613 (35.9) 20662 (64.1) 9126 (9.0) 92869 (91.0)
DOI: https://doi.org/10.36922/jctr.22.00239