
Page 56 - MI-2-1
P. 56
Microbes & Immunity ABO blood type and cancer risk: A complex relationship
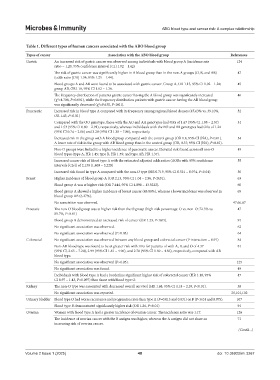
Table 1. Different types of human cancers associated with the ABO blood group
Types of cancer Association with the ABO blood group References
Gastric An increased risk of gastric cancer was observed among individuals with blood group A (incidence rate 124
ratio = 1.20, 95% confidence interval [CI] 1.02 – 1.42)
The risk of gastric cancer was significantly higher in A blood group than in the non-A groups (O, B, and AB) 47
(odds ratio [OR] 1.34; 95% 1.25 – 1.44).
Blood groups A and AB were found to be associated with gastric cancer: Group A, OR 1.13, 95% CI 1.02 – 1.24; 45
group AB, OR1.18, 95% CI 1.02 – 1.36.
The frequency distribution of patients gastric cancer having the A blood group was significantly increased 46
2
(χ =4.708, P<0.001), while the frequency distribution patients with gastric cancer having the AB blood group
2
was significantly decreased (χ =9.630, P<0.01).
Pancreatic Increased risk in blood type A compared with its frequency among regional blood donors (47.63% vs. 39.10%, 52
OR 1.43, P<0.01)
Compared with the OO genotype, those with the AO and AA genotypes had ORs of 1.67 (95% CI 1.08 – 2.57) 51
and 1.53 (95% CI 0.80 – 2.91), respectively, whereas individuals with the BO and BB genotypes had ORs of 1.24
(95% CI 0.74 – 2.06) and 3.28 (95% CI 1.38 – 7.80), respectively.
Increased risk in the group with A blood group compared with the control group (OR 1.8, 95% CI (NA), P<0.01). 54
A lower rate of risk in the group with AB blood group than in the control group (OR, 0.37; 95% CI (NA), P<0.01).
Non-O groups were linked to a higher incidence of pancreatic cancer. Elevated risk found across all non-O 49
blood types (type A, HR 1.45; type B, HR 1.59; and type AB, HR 1.37).
Increased cancer risk of blood type A with the estimated adjusted odds ratios (AORs with 95% confidence 55
intervals [CIs]) of 2.130 (1.409 – 3.220)
Increased risk found in type A compared with the non-O type (HR 0.719, 95% CI 0.521 – 0.974, P<0.01) 50
Breast Higher incidence of blood group A (OR 2.13, 95% CI 1.04 – 2.96, P<0.01). 63
Blood group A was at higher risk (OR 7.444, 95% CI 4.098 – 13.5222). 60
Blood group A showed a higher incidence of breast cancer (45.88%), whereas a lower incidence was observed in 65
blood group AB (6.27%).
No association was observed. 47,66,67
Prostatic The non-O blood group was at higher risk than the O group (high-risk percentage: O vs. non-O: 72.5% vs. 47
85.7%, P<0.01)
Blood group B demonstrated an increased risk of cancer (OR 1.23, P<0.05). 91
No significant association was observed. 62
No significant association was observed (P>0.05) 64
Colorectal No significant association was observed between any blood group and colorectal cancer (P interaction = 0.91) 84
Non-AB blood type was found to be at greater risk with HRs for patients of with A, B, and O of 4.37 81
(95% CI, 2.65 – 7.20), 2.99 (95% CI 1.81 – 4.96), and 2.78 (95% CI 1.69 – 4.56), respectively, compared with AB
blood type.
No significant association was observed (P>0.05). 125
No significant association was found. 49
Individuals with blood type A had a borderline significant higher risk of colorectal cancer (HR 1.18, 95% 47
CI 0.97 – 1.43, P=0.097) than those with blood type O.
Kidney The non-O type was associated with decreased overall survival (HR 1.68, 95% CI 1.18 – 2.39, P<0.01). 38
No significant association was reported. 26,101,102
Urinary bladder Blood type O had worse recurrence and progression rates than type A (P=0.015 and 0.031) or B (P<0.01 and 0.075). 107
Blood type B demonstrated significantly higher risk (OR 1.26, P<0.01) 91
Ovarian Women with blood type A had a greater incidence of ovarian cancer. The incidence ratio was 1:17. 126
The incidence of ovarian cancer with the B antigen was higher, whereas the A antigen did not share an 71
increasing risk of ovarian cancer.
(Cont’d...)
Volume 2 Issue 1 (2025) 48 doi: 10.36922/mi.3267