
Page 124 - MI-2-3
P. 124
Microbes & Immunity Statistical modeling of COVID-19 trends
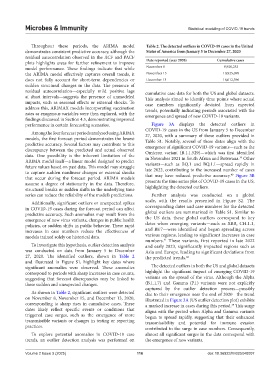
Throughout these periods, the ARIMA model Table 2. The detected outliers in COVID‑19 cases in the United
demonstrates consistent predictive accuracy, although the States of America from January 5 to December 27, 2020
residual autocorrelation observed in the ACF and PACF Date reported (year 2020) Cumulative cases
plots highlights areas for further refinement to improve
model performance. These findings indicate that while November 8 9,920,253
the ARIMA model effectively captures overall trends, it November 15 10,925,098
does not fully account for short-term dependencies or December 13 16,012,396
sudden structural changes in the data. The presence of
residual autocorrelation—especially mild positive lags cumulative case data for both the US and global datasets.
at short intervals—suggests the presence of unmodeled This analysis aimed to identify time points where actual
impacts, such as seasonal effects or external shocks. To case numbers significantly deviated from expected
address this, ARIMAX models incorporating vaccination trends, potentially indicating periods associated with the
rates as exogenous variables were then explored, with the emergence and spread of new COVID-19 variants.
findings discussed in Section 4.5, demonstrating improved
performance in certain forecasting scenarios. Figure 3A displays the detected outliers in
COVID-19 cases in the US from January 5 to December
Among the four forecast periods analyzed using ARIMA 27, 2020, with a summary of these outliers provided in
models, the first forecast period demonstrates the lowest Table S1. Notably, several of these dates align with the
predictive accuracy. Several factors may contribute to this emergence of significant COVID-19 variants—such as the
discrepancy between the predicted and actual observed Omicron variant (B.1.1.529)—which was first identified
data. One possibility is the inherent limitation of the in November 2021 in South Africa and Botswana. Other
39
ARIMA model itself—a linear model designed to predict variants—such as BQ.1 and BQ.1.1—spread rapidly in
future values based on past data. This model may struggle late 2022, contributing to the increased number of cases
to capture sudden nonlinear changes or external shocks that may have reduced predictive accuracy. Figure 3B
40
that occur during the forecast period. ARIMA models presents the time series plot of COVID-19 cases in the US,
assume a degree of stationarity in the data. Therefore,
structural breaks or sudden shifts in the underlying time highlighting the detected outliers.
series can reduce the reliability of the model’s predictions. Further analysis was conducted on a global
Additionally, significant outliers or unexpected spikes scale, with the results presented in Figure S2. The
in COVID-19 cases during the forecast period can affect corresponding dates and case numbers for the detected
predictive accuracy. Such anomalies may result from the global outliers are summarized in Table S1. Similar to
emergence of new virus variants, changes in public health the US data, these global outliers correspond to key
policies, or sudden shifts in public behavior. These rapid dates when emerging variants—such as XBB, CH.1.1,
increases in case numbers reduce the effectiveness of and BF.7—were identified and began spreading across
models trained solely on historical data. various regions, leading to significant increases in case
numbers. These variants, first reported in late 2022
41
To investigate this hypothesis, outlier detection analysis and early 2023, significantly impacted regions such as
was conducted on data from January 5 to December Asia and Europe, leading to significant deviations from
27, 2020. The identified outliers, shown in Table 2 the predicted trends. 42
and illustrated in Figure S1, highlight key dates where
significant anomalies were observed. These anomalies The detected outliers in both the US and global datasets
correspond to periods with sharp increases in case counts, highlight the significant impact of emerging COVID-19
suggesting that forecast discrepancies may be linked to variants on the spread of the virus. Although the Alpha
these sudden and unexpected changes. (B.1.1.7) and Gamma (P.1) variants were not explicitly
captured by the outlier detection process—possibly
As shown in Table 2, significant outliers were detected due to their emergence near the end of 2020—the trend
on November 8, November 15, and December 13, 2020, illustrated in Figure 3A (US outlier detection plot) exhibits
corresponding to sharp rises in cumulative cases. These a marked increase in cases during this period. This surge
39
dates likely reflect specific events or conditions that aligns with the period when Alpha and Gamma variants
triggered case surges, such as the emergence of more began to spread rapidly, suggesting that their enhanced
transmissible variants or changes in testing or reporting transmissibility and potential for immune evasion
practices. contributed to the surge in case numbers. Consequently,
To explore potential anomalies in COVID-19 case almost all significant surges in the data correspond with
trends, an outlier detection analysis was performed on the emergence of new variants.
Volume 2 Issue 3 (2025) 116 doi: 10.36922/MI025040007