
Page 127 - MI-2-3
P. 127
Microbes & Immunity Statistical modeling of COVID-19 trends
A B
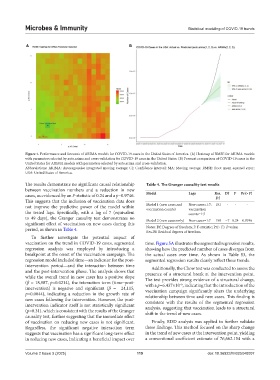
Figure 4. Performance and forecasts of ARIMA models for COVID-19 cases in the United States of America. (A) Heatmap of RMSE for ARIMA models
with parameters selected by auto.arima and cross-validation for COVID-19 cases in the United States. (B) Forecast comparison of COVID-19 cases in the
United States for ARIMA models with parameters selected by auto.arima and cross-validation.
Abbreviations: ARIMA: Autoregressive integrated moving average; CI: Confidence interval; MA: Moving average; RMSE: Root mean squared error;
USA: United States of America.
The results demonstrate no significant causal relationship Table 4. The Granger causality test results
between vaccination numbers and a reduction in new
cases, as evidenced by an F-statistic of 0.24 and a p=0.9746. Model Lags Res. Df F Pr(> F)
Df
This suggests that the inclusion of vaccination data does
not improve the predictive power of the model within Model 1 (new cases and New cases=1:7; 151 - - -
vaccination
vaccination counts)
the tested lags. Specifically, with a lag of 7 (equivalent counts=1:7
to 49 days), the Granger causality test demonstrates no Model 2 (new cases only) New cases=1:7 158 −7 0.24 0.9746
significant effect of vaccination on new cases during this
period, as shown in Table 4. Notes: Df: Degrees of freedom; F: F-statistic; Pr(> F): P-value;
Res.Df: Residual degrees of freedom.
To further investigate the potential impact of
vaccination on the trend in COVID-19 cases, segmented time. Figure 5A illustrates the segmented regression results,
regression analysis was employed by introducing a showing how the predicted number of cases diverges from
breakpoint at the onset of the vaccination campaign. The the actual cases over time. As shown in Table S3, the
regression model included time—an indicator for the post- segmented regression results clearly reflect these trends.
intervention period—and the interaction between time Additionally, the Chow test was conducted to assess the
and the post-intervention phase. The analysis shows that presence of a structural break at the intervention point.
while the overall trend in new cases has a positive slope The test provides strong evidence of a structural change,
(β = 18,987, p=0.0214), the interaction term (time–post- with a p=6.437×10 , indicating that the introduction of the
–6
intervention) is negative and significant (β = −24,115, vaccination campaign significantly alters the underlying
p=0.0044), indicating a reduction in the growth rate of relationship between time and new cases. This finding is
new cases following the intervention. However, the post- consistent with the results of the segmented regression
intervention indicator itself is not statistically significant analysis, suggesting that vaccination leads to a structural
(p=0.31), which is consistent with the results of the Granger shift in the trend of new cases.
causality test, further suggesting that the immediate effect
of vaccination on reducing new cases is not significant. Finally, RDD analysis was applied to further validate
Regardless, the significant negative interaction term these findings. This method focused on the sharp change
suggests that vaccination has a significant long-term effect in the trend of new cases at the intervention point, yielding
in reducing new cases, indicating a beneficial impact over a conventional coefficient estimate of 76,662.154 with a
Volume 2 Issue 3 (2025) 119 doi: 10.36922/MI025040007