
Page 128 - MI-2-3
P. 128
Microbes & Immunity Statistical modeling of COVID-19 trends
A ARIMA model, which does not account for such external
factors.
To test this hypothesis, the dataset starting from
December 13, 2020—the beginning of the vaccination
campaign—was employed. Given the evidence that the
impact of vaccination is more pronounced over time,
the first forecast period selected spanned from January
5, 2020, to June 27, 2021—approximately 6 months after
vaccination began. This period was used to predict the
cumulative number of cases for the subsequent 3 months.
B Following this, the training data period was gradually
extended across 3 time periods:
(i) January 5, 2020 – June 27, 2021,
(ii) January 5, 2020 – December 26, 2021,
(iii) January 5, 2020 – September 25, 2022.
Figures 6, S5, and S6 compare the ARIMA and
ARIMAX model predictions across these periods, while
Tables 5, S5, and S6 present the evaluation metrics (AIC,
RMSE, and MAE) for both models.
These results indicate that the ARIMAX model
generally produces forecasts that are closer to the actual
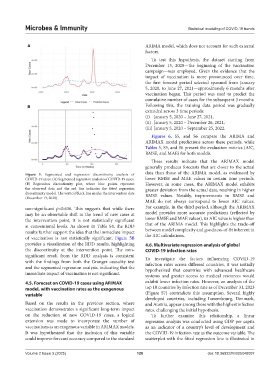
Figure 5. Segmented and regression discontinuity analysis of data than those of the ARIMA model, as evidenced by
COVID-19 cases. (A) Segmented regression analysis of COVID-19 cases. lower RMSE and MAE values in certain time periods.
(B) Regression discontinuity plot, where blue points represent However, in some cases, the ARIMAX model exhibits
the observed data and the red line indicates the fitted regression greater deviation from the actual data, resulting in higher
discontinuity model. The vertical black line marks the intervention date RMSE values. Notably, improvements in RMSE and
(December 13, 2020).
MAE do not always correspond to lower AIC values.
non-significant p=0.636. This suggests that while there For example, in the third period, although the ARIMAX
may be an observable shift in the trend of new cases at model provides more accurate predictions (reflected by
the intervention point, it is not statistically significant lower RMSE and MAE values), its AIC value is higher than
at conventional levels. As shown in Table S4, the RDD that of the ARIMA model. This highlights the trade-off
results further support the idea that the immediate impact between model complexity and goodness-of-fit inherent in
of vaccination is not statistically significant. Figure 5B the AIC calculations.
provides a visualization of the RDD results, highlighting 4.6. Multivariate regression analysis of global
the discontinuity at the intervention point. The non- COVID-19 infection rates
significant result from the RDD analysis is consistent To investigate the factors influencing COVID-19
with the findings from both the Granger causality test infection rates across different countries, it was initially
and the segmented regression analysis, indicating that the hypothesized that countries with advanced healthcare
immediate impact of vaccination is not significant.
systems and greater access to medical resources would
4.5. Forecast on COVID-19 cases using ARIMAX exhibit lower infection rates. However, an analysis of the
model, with vaccination rates as the exogenous top 10 countries by infection rate as of December 31, 2023
variable (Figure S7) contradicts this assumption. Several highly
developed countries, including Luxembourg, Denmark,
Based on the results in the previous section, where and Austria, appear among those with the highest infection
vaccination demonstrates a significant long-term impact rates, challenging the initial hypothesis.
on the reduction of new COVID-19 cases, a logical To further examine this relationship, a linear
extension was made to incorporate the number of regression analysis was conducted using GDP per capita
vaccinations as an exogenous variable in ARIMAX models. as an indicator of a country’s level of development and
It was hypothesized that the inclusion of this variable the COVID-19 infection rate as the outcome variable. The
could improve forecast accuracy compared to the standard scatterplot with the fitted regression line is illustrated in
Volume 2 Issue 3 (2025) 120 doi: 10.36922/MI025040007