
Page 126 - MI-2-3
P. 126
Microbes & Immunity Statistical modeling of COVID-19 trends
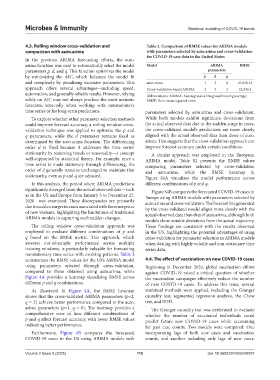
4.3. Rolling window cross-validation and Table 3. Comparison of RMSE values for ARIMA models
comparison with auto.arima with parameters selected by auto.arima and cross‑validation
for COVID‑19 case data in the United States
In the previous ARIMA forecasting efforts, the auto.
arima function was used to automatically select the model Model ARIMA RMSE
parameters p, d, and q. This function optimizes the model parameters
by minimizing the AIC, which balances the model fit p d q
and complexity by penalizing excessive parameters. This auto.arima 1 2 0 27,648.12
approach offers several advantages—including speed, Cross-validation-based ARIMA 2 2 2 22,949.3
automation, and generally reliable results. However, relying Abbreviations: ARIMA: Autoregressive integrated moving average;
solely on AIC may not always produce the most accurate RMSE: Root mean squared error.
forecasts, especially when working with nonstationary
time series or for long-term predictions. parameters selected by auto.arima and cross-validation.
To explore whether other parameter selection methods While both models exhibit significant deviations from
could improve forecast accuracy, a rolling window cross- the actual observed data due to the sudden surge in cases,
validation technique was applied to optimize the p and the cross-validated model’s predictions are more closely
q parameters, while the d parameter remains fixed as aligned with the actual observed data than those of auto.
determined by the auto.arima function. The differencing arima. This suggests that the cross-validation approach can
order d is fixed because it addresses the time series’ improve forecast accuracy under certain conditions.
stationarity by removing trends or seasonality—a concept A similar approach was employed in the European
well-supported by statistical theory. For example, once a ARIMA model. Table S2 presents the RMSE values
time series is made stationary through differencing, the comparing parameters selected by cross-validation
order of d generally remains unchanged to maintain that and auto.arima, while the RMSE heatmap in
stationarity, even as p and q are adjusted. Figure S4A visualizes the model performance across
In this analysis, the period where ARIMA predictions different combinations of p and q.
significantly diverged from the actual observed data—such Figure S4B compares the forecasted COVID-19 cases in
as in the US and Europe from January 5 to December 27, Europe using ARIMA models with parameters selected by
2020—was examined. These discrepancies are primarily auto.arima and cross-validation. The forecast line generated
due to sudden surges in cases associated with the emergence by the cross-validated model aligns more closely with the
of new variants, highlighting the limitations of traditional actual observed data than that of auto.arima, although both
ARIMA models in capturing such sudden changes.
models show notable deviations from the actual trajectory.
The rolling window cross-validation approach was These findings are consistent with the results observed
employed to evaluate different combinations of p and in the US, highlighting the potential advantages of using
q based on the RMSE metric. This approach, which cross-validation for parameter selection in ARIMA models
assesses out-of-sample performance across multiple when dealing with highly volatile and non-stationary time
training windows, is particularly valuable for forecasting series data.
nonstationary time series with evolving patterns. Table 3
summarizes the RMSE values for the US’s ARIMA model 4.4. The effect of vaccination on new COVID-19 cases
using parameters selected through cross-validation, Beginning in December 2020, global vaccination efforts
compared to those obtained using auto.arima, while against COVID-19 raised a critical question of whether
Figure 4A provides a heatmap visualizing RMSE across the vaccination campaigns effectively reduce the number
different p and q combinations. of new COVID-19 cases. To address this issue, several
As illustrated in Figure 4A, the RMSE heatmap statistical methods were applied, including the Granger
shows that the cross-validated ARIMA parameters (p=2, causality test, segmented regression analysis, the Chow
q = 2) achieve better performance compared to the auto. test, and RDD.
arima parameters (p=1, q = 0). The heatmap provides a The Granger causality test was performed to evaluate
comprehensive view of how different combinations of whether the number of vaccinated individuals could
p and q affect forecast accuracy, with lower RMSE values predict future new COVID-19 cases while accounting
indicating better performance. for past case counts. Two models were compared: One
Furthermore, Figure 4B compares the forecasted incorporating lags of both new cases and vaccination
COVID-19 cases in the US using ARIMA models with counts, and another including only lags of new cases.
Volume 2 Issue 3 (2025) 118 doi: 10.36922/MI025040007