
Page 125 - MI-2-3
P. 125
Microbes & Immunity Statistical modeling of COVID-19 trends
A B
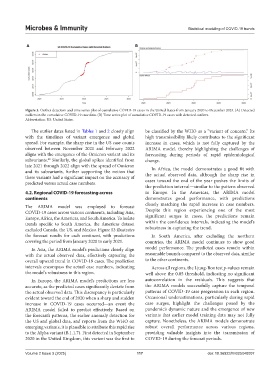
Figure 3. Outlier detection and time series plot of cumulative COVID-19 cases in the United States from January 2020 to December 2023. (A) Detected
outliers in the cumulative COVID-19 case data. (B) Time series plot of cumulative COVID-19 cases with detected outliers.
Abbreviation: US: United States.
The outlier dates listed in Tables 1 and 2 closely align be classified by the WHO as a “variant of concern.” Its
with the timelines of variant emergence and global high transmissibility likely contributes to the significant
spread. For example, the sharp rise in the US case counts increase in cases, which is not fully captured by the
observed between November 2021 and February 2022 ARIMA model, thereby highlighting the challenges of
aligns with the emergence of the Omicron variant and its forecasting during periods of rapid epidemiological
subvariants. Similarly, the global spikes identified from change.
40
late 2021 through 2022 align with the spread of Omicron In Africa, the model demonstrates a good fit with
and its subvariants, further supporting the notion that
these variants had a significant impact on the accuracy of the actual observed data, although the sharp rise in
predicted versus actual case numbers. cases toward the end of the year pushes the limits of
the prediction interval—similar to the pattern observed
4.2. Regional COVID-19 forecasting across in Europe. In the Americas, the ARIMA model
continents demonstrates good performance, with predictions
closely matching the rapid increase in case numbers.
The ARIMA model was employed to forecast
COVID-19 cases across various continents, including Asia, Despite this region experiencing one of the most
Europe, Africa, the Americas, and South America. To isolate significant surges in cases, the predictions remain
trends specific to South America, the Americas dataset within the confidence intervals, indicating the model’s
excluded Canada, the US, and Mexico. Figure S3 illustrates robustness in capturing the trend.
the forecast results for each continent, with predictions In South America, after excluding the northern
covering the period from January 2020 to early 2021. countries, the ARIMA model continues to show good
In Asia, the ARIMA model’s predictions closely align model performance. The predicted cases remain within
with the actual observed data, effectively capturing the reasonable bounds compared to the observed data, similar
overall upward trend in COVID-19 cases. The prediction to the other continents.
intervals encompass the actual case numbers, indicating Across all regions, the Ljung-Box test p-values remain
the model’s robustness in this region. well above the 0.05 threshold, indicating no significant
In Europe, the ARIMA model’s predictions are less autocorrelation in the residuals. This suggests that
accurate, as the predicted cases significantly deviate from the ARIMA models successfully capture the temporal
the actual observed data. This discrepancy is particularly patterns of COVID-19 case progression in each region.
evident toward the end of 2020 when a sharp and sudden Occasional underestimations, particularly during rapid
increase in COVID-19 cases occurred—an event the case surges, highlight the challenges posed by the
ARIMA model failed to predict effectively. Based on pandemic’s dynamic nature and the emergence of new
the forecast’s patterns, the earlier anomaly detection for variants that earlier model training data may not fully
the US and global data, and reports from the WHO on capture. Nonetheless, the ARIMA models demonstrate
emerging variants, it is plausible to attribute this rapid rise robust overall performance across various regions,
to the Alpha variant (B.1.1.7). First detected in September providing valuable insights into the transmission of
2020 in the United Kingdom, this variant was the first to COVID-19 during the forecast periods.
Volume 2 Issue 3 (2025) 117 doi: 10.36922/MI025040007