
Page 129 - MI-2-3
P. 129
Microbes & Immunity Statistical modeling of COVID-19 trends
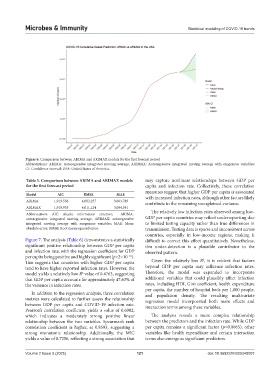
Figure 6. Comparison between ARIMA and ARIMAX models for the first forecast period
Abbreviations: ARIMA: Autoregressive integrated moving average; ARIMAX: Autoregressive integrated moving average with exogenous variables;
CI: Confidence interval; USA: United States of America.
Table 5. Comparison between ARIMA and ARIMAX models may capture nonlinear relationships between GDP per
for the first forecast period capita and infection rate. Collectively, these correlation
measures suggest that higher GDP per capita is associated
Model AIC RMSE MAE
with increased infection rates, although other factors likely
ARIMA 1,919.556 4,082,257 3,063,789 contribute to the remaining unexplained variance.
ARIMAX 1,919.935 4,011,124 3,004,951
Abbreviations: AIC: Akaike information criterion; ARIMA: The relatively low infection rates observed among low-
autoregressive integrated moving average; ARIMAX: autoregressive GDP per capita countries may reflect underreporting due
integrated moving average with exogenous variables; MAE: Mean to limited testing capacity rather than true differences in
absolute error; RMSE: Root mean squared error. transmission. Testing data is sparse and inconsistent across
countries, especially in low-income regions, making it
Figure 7. The analysis (Table 6) demonstrates a statistically difficult to correct this effect quantitatively. Nonetheless,
significant positive relationship between GDP per capita this under-detection is a plausible contributor to the
and infection rate, with the regression coefficient for GDP observed pattern.
per capita being positive and highly significant (p<2×10 ).
−16
2
This suggests that countries with higher GDP per capita Given the relatively low R , it is evident that factors
tend to have higher reported infection rates. However, the beyond GDP per capita may influence infection rates.
model yields a relatively low R value of 0.4763, suggesting Therefore, the model was expanded to incorporate
2
that GDP per capita accounts for approximately 47.63% of additional variables that could plausibly affect infection
the variance in infection rates. rates, including HDI, Gini coefficient, health expenditure
per capita, the number of hospital beds per 1,000 people,
In addition to the regression analysis, three correlation and population density. The resulting multivariate
metrics were calculated to further assess the relationship regression model incorporated both main effects and
between GDP per capita and COVID-19 infection rate. interaction terms among these variables.
Pearson’s correlation coefficient yields a value of 0.6902,
which indicates a moderately strong positive linear The analysis reveals a more complex relationship
relationship between the two variables. Spearman’s rank between the predictors and the infection rate. While GDP
correlation coefficient is higher, at 0.8593, suggesting a per capita remains a significant factor (p=0.0065), other
strong monotonic relationship. Additionally, the MIC variables like health expenditure and certain interaction
yields a value of 0.7256, reflecting a strong association that terms also emerge as significant predictors.
Volume 2 Issue 3 (2025) 121 doi: 10.36922/MI025040007