
Page 133 - MI-2-3
P. 133
Microbes & Immunity Statistical modeling of COVID-19 trends
4.8. Spatial autocorrelation and hotspot analysis of To identify specific clusters of high or low case rates, the
COVID-19 cases across states in the United States Getis-Ord Gi* statistic was employed, providing a measure
of local spatial clustering. As shown in Figure 10B, the
A spatial autocorrelation and hotspot analysis of
COVID-19 cases across states in the US was conducted. hotspot analysis reveals several hotspots and coldspots.
Spatial autocorrelation assessed the degree to which Southern states—such as Arkansas, Georgia, and
COVID-19 cases are geographically clustered, while Mississippi, as well as parts of Texas and Ohio—are
hotspot analysis identified regions with significantly high identified as hotspots, with high Gi* values, indicating
or low case counts. significant clustering of high case rates. Conversely, states
like Alaska, Delaware, New Hampshire, and Vermont are
Using the most recent COVID-19 case data across identified as coldspots, suggesting significant clustering of
states in the US, the number of cases per 100,000 people low case rates.
was calculated to account for population differences. In addition, Table S13 lists the top 10 hotspot and
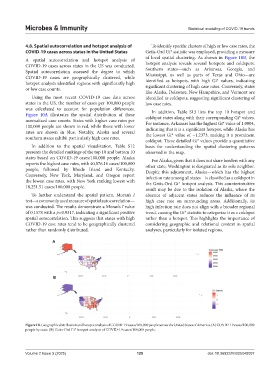
Figure 10A illustrates the spatial distribution of these coldspot states along with their corresponding Gi* values.
normalized case counts. States with higher case rates per
100,000 people are shown in red, while those with lower For instance, Arkansas has the highest Gi* value of 1.0004,
indicating that it is a significant hotspot, while Alaska has
rates are shown in blue. Notably, Alaska and several the lowest Gi* value of −1.2373, making it a prominent
southern states exhibit particularly high case rates.
coldspot. These detailed Gi* values provide a quantitative
In addition to the spatial visualization, Table S12 basis for understanding the spatial clustering patterns
presents the detailed rankings of the top 10 and bottom 10 observed in the map.
states based on COVID-19 cases/100,000 people. Alaska For Alaska, given that it does not share borders with any
reports the highest case rates, with 40,576.16 cases/100,000 other state, Washington is designated as its sole neighbor.
people, followed by Rhode Island and Kentucky. Despite this adjustment, Alaska—which has the highest
Conversely, New York, Maryland, and Oregon report infection rate among all states—is classified as a coldspot in
the lowest case rates, with New York ranking lowest with the Getis-Ord Gi* hotspot analysis. This counterintuitive
18,251.51 cases/100,000 people.
result may be due to the isolation of Alaska, where the
To further understand the spatial pattern, Moran’s I absence of adjacent states reduces the influence of its
test—a commonly used measure of spatial autocorrelation— high case rate on surrounding areas. Additionally, its
was conducted. The results demonstrate a Moran’s I value high infection rate does not align with a broader regional
of 0.1578 with a p=0.0317, indicating a significant positive trend, causing the Gi* statistic to categorize it as a coldspot
spatial autocorrelation. This suggests that states with high rather than a hotspot. This highlights the importance of
COVID-19 case rates tend to be geographically clustered considering geographic and relational context in spatial
rather than randomly distributed. analyses, particularly for isolated regions.
A
B
Figure 10. Geographic distribution and hotspot analysis of COVID-19 cases/100,000 people across the United States of America. (A) COVID-19 cases/100,000
people by state. (B) Getis-Ord Gi* hotspot analysis of COVID-19 cases/100,000 people.
Volume 2 Issue 3 (2025) 125 doi: 10.36922/MI025040007