
Page 131 - MI-2-3
P. 131
Microbes & Immunity Statistical modeling of COVID-19 trends
A
B
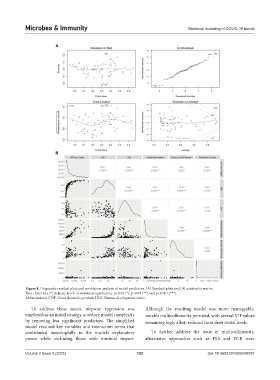
Figure 8. Diagnostic residual plots and correlation analysis of model predictors. (A) Residual plots and (B) scatterplot matrix.
Note: Asterisks (*) indicate levels of statistical significance: p<0.05 (*), p<0.01 (**), and p<0.001 (***).
Abbreviations: GDP: Gross domestic product; HDI: Human development index.
To address these issues, stepwise regression was Although the resulting model was more manageable,
employed as an initial strategy to reduce model complexity notable multicollinearity persisted, with several VIF values
by removing less significant predictors. The simplified remaining high, albeit reduced from their initial levels.
model retained key variables and interaction terms that
contributed meaningfully to the model’s explanatory To further address the issue of multicollinearity,
power while excluding those with minimal impact. alternative approaches such as PLS and PCR were
Volume 2 Issue 3 (2025) 123 doi: 10.36922/MI025040007