
Page 86 - MI-2-3
P. 86
Microbes & Immunity Carotene and immunity to COVID-19 vaccine
3.2.3. Taxonomic abundance cluster heatmap
The composition of the microbial community was
visualized with a composition heatmap (Figure 8). The
Y-axis represents the bacterial taxa, and the X-axis
represents samples. The colour of each intersection depicts
the taxon abundance in the sample.
3.2.4. Differential abundance analysis
Differential abundance analysis is carried out to determine
the differences between microbial communities. In this
project, multiple differential abundance analysis methods
(e.g., DESeq2, LEfSe, and Corncob) were utilized to cross-
validate results as different methods varied in statistical
assumptions regarding data distribution, sparsity, and the
handling of zero inflation. Applying multiple methods
26
yielded overlapping and distinct sets of differentially
abundant taxa. The differences can be attributed to the
varying statistical assumptions. Overlapping taxa suggest a
high level of confidence in the biological relevance of these
Figure 4. Splenocyte proliferation rate across baseline (fed daily with the taxa, as they are robustly detected across methods that
vehicle), baseline vaccinated (fed daily with the vehicle and injected with
CoronaVac), carotene (fed daily with carotene), and carotene vaccinated handle data differently. This combined approach allows
(fed daily with carotene and injected with CoronaVac) groups at day 70. for a comprehensive assessment of microbial changes, and
The splenocytes were cultured in the presence of CoronaVac (10 µg/ taxa that were consistently identified across methods were
mL) for 72 h. Splenocyte proliferation was determined using the Cell prioritized for interpretation in this study.
Counting Kit-8. Data are presented as the percentage of cell culture
compared to proliferation observed in the splenocyte cultured from mice (a) Modulation of gut microbiome by carotene in
in the baseline group, expressed as mean ± SD, derived from six mice unvaccinated groups
(n=6) per group.
Note: *p<0.05. Carotene supplementation in the unvaccinated group
displayed a reduction in Odoribacter, as identified by both
LEfSe and DESeq2 analyses, and a reduction of Monoglobus,
as indicated by DESeq2 and corncob methods (Figure 9).
(b) Modulation of gut microbiome by carotene in
vaccinated groups
The DESeq2 and corncob analyses reported
enrichment of the Ruminococcaceae family and reduction
of the Mucispirillum genus in the vaccinated carotene
supplementation group (Figure 10).
3.3. Effect of carotene supplementation on SCFA
production
SCFAs are crucial metabolites produced by intestinal
microbiota that contribute to intestinal and immune
homeostasis. Targeted metabolomics was carried out to
quantify the levels of SCFAs in fecal samples using GC-MS
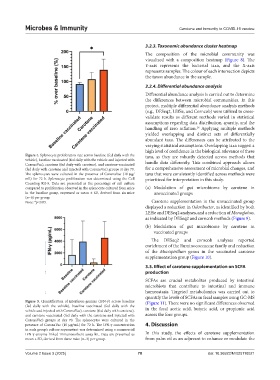
Figure 5. Quantification of interferon-gamma (IFN-γ) across baseline (Figure 11). There were no significant differences observed
(fed daily with the vehicle), baseline vaccinated (fed daily with the in the fecal acetic acid, butyric acid, or propionic acid
vehicle and injected with CoronaVac), carotene (fed daily with carotene),
and carotene vaccinated (fed daily with the carotene and injected with across the four groups.
CoronaVac) groups at day 70. The splenocytes were cultured in the
presence of CoronaVac (10 µg/mL) for 72 h. The IFN-γ concentration 4. Discussion
in each group’s culture supernatant was determined using a commercial
IFN-γ enzyme-linked immunosorbent assay kit. Data are presented as In this study, the effects of carotene supplementation
mean ± SD, derived from three mice (n=3) per group. from palm oil as an adjuvant to enhance or modulate the
Volume 2 Issue 3 (2025) 78 doi: 10.36922/MI025110021