
Page 88 - MI-2-3
P. 88
Microbes & Immunity Carotene and immunity to COVID-19 vaccine
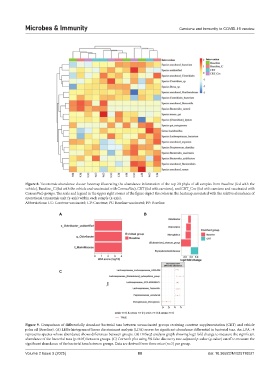
Figure 8. Taxonomic abundance cluster heatmap illustrating the abundance information of the top 20 phyla of all samples from Baseline (fed with the
vehicle), Baseline_C (fed with the vehicle and vaccinated with CoronaVac), CRT (fed with carotene), and CRT_Cov (fed with carotene and vaccinated with
CoronaVac) groups. The scale and legend in the upper right corner of the figure depict the colors in the heatmap associated with the relative abundance of
operational taxonomic unit (y-axis) within each sample (x-axis).
Abbreviations: CC: Carotene vaccinated; CP: Carotene; PC: Baseline vaccinated; PP: Baseline.
A B
C
Figure 9. Comparison of differentially abundant bacterial taxa between unvaccinated groups receiving carotene supplementation (CRT) and vehicle
palm oil (Baseline). (A) LEfSe histogram of linear discriminant analysis (LDA) scores for significant abundance differential in bacterial taxa. An LDA >4
represents species whose abundance shows differences between groups. (B) DESeq2 analysis graph showing log2 fold change to measure the significant
abundance of the bacterial taxa (p<0.05) between groups. (C) Corncob plot using 5% false discovery rate-adjusted p-value (q-value) cutoff to measure the
significant abundance of the bacterial taxa between groups. Data are derived from three mice (n=3) per group.
Volume 2 Issue 3 (2025) 80 doi: 10.36922/MI025110021