
Page 29 - MSAM-1-1
P. 29
Materials Science in Additive Manufacturing Spheroidization of 304L SS powder for LPBF process
simulations were performed by varying the powder’s of the as-received and spheroidized materials predicted by
nitrogen content to predict its influence on the material JMatPro simulations, with the only difference being in the
strength. Figure 14 compares the strength and hardness nitrogen content (as discussed in Table 4). A decrease in the
strength of material is predicted. While this difference may
Table 5. Flowability comparison using the Revolution not be as large as the one found in the tensile test results, the
Powder Analyzer for as‑received and spheroidized 304L simulations indicate that reduction in nitrogen can reduce
powders. the strength of austenitic stainless steels.
Sample Avalanche angle (°) Break energy From SEM micrographs of some cross-sections on the x-z
(mJ/kg) plane (Figure 15) for investigating the microstructure, it can
As-received 45.4 ± 1.5 43.2 ± 5.1 be observed that the parts built with the as-received powder
Spheroidized 42.4 ± 0.8 28.7 ± 1.2 (Figure 15A and B) are mostly comprised of a cellular
microstructure all around the melt pool. However, the parts
built with spheroidized powder (Figure 15C and D) exhibit
Table 6. Variation in mechanical properties of fabricated cellular microstructure only at the melt pool boundaries. In
parts with as‑received and spheroidized powders.
contrast, a sharp transition to a featureless region towards
Property Type Mean Standard the center of the melt pool develops.
deviation
Moreover, as the chrome-nickel equivalency
YS (MPa) As-received 507.27 14.55 decreased, the amount of cellular microstructure
Spheroidized 438.18 18.61 within the weld increased due to a shift toward primary
UTS (MPa) As-received 688.71 19.76 austenite solidification. Therefore, using identical process
Spheroidized 654.61 11.18 parameters, the proportion of cellular and featureless
regions in Figure 15 is controlled by powder chemistry. As
Strain at break As-received 0.66 0.044 the chrome-nickel equivalency increased, the ratio of the
Spheroidized 0.84 0.06 featureless phase to the cellular phase increased, hinting
YS: Yield strength; UTS: Ultimate tensile strength. at a change in the solidification mode. It should be noted
that the featureless and cellular phases indicate FA and
A B AF solidification modes, respectively, as denoted in the
SEM images in Figure 15. Therefore, the increase in the
chrome-nickel equivalency of the powder during plasma
spheroidization agrees well with the observed increase in
the part’s featureless phase. As mentioned in the previous
discussion of the particle microstructure, the decrease in
C and N caused the chrome-nickel equivalency to increase
from 1.50 to 1.74 (Table 4). Therefore, the drastic change
in the part microstructure results from a change in the
powder chemistry, shifting the solidification mode from
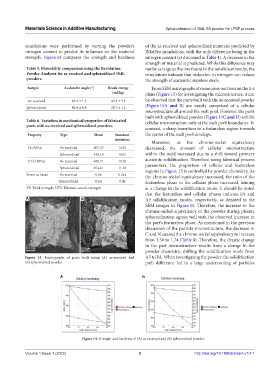
Figure 13. Fractographs of parts built using (A) as-received and AF to FA. When investigating the powder, the solidification
(B) spheroidized powder. path difference led to a large undercooling of particles
A B
Figure 14. Strength and hardness of (A) as-received and (B) spheroidized powder.
Volume 1 Issue 1 (2022) 9 http://doi.org/10.18063/msam.v1i1.1