
Page 45 - MSAM-1-1
P. 45
Materials Science in Additive Manufacturing Crack-free AA7075 with Zr modification via LPBF
A B C
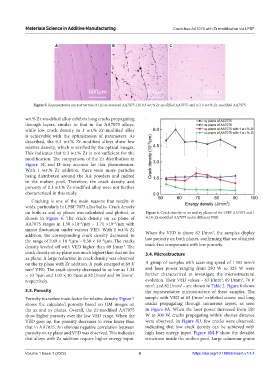
Figure 5. Representative microstructure of (A) as-received AA7075, (B) 0.3 w.t.% Zr-modified AA7075, and (C) 1 w.t.% Zr-modified AA7075.
w.t.% Zr-modified alloy exhibits long cracks propagating
through layers, similar to that in the AA7075 alloys,
while low crack density in 1 w.t.% Zr-modified alloy
is achievable with the optimization of parameters. As
described, the 0.3 w.t.% Zr-modified alloys show low
relative density, which is verified by the optical images.
This indicates that 0.3 w.t.% Zr is not sufficient for the
modification. The comparison of the Zr distribution in
Figure 1C and D may account for this phenomenon.
With 1 w.t.% Zr addition, there were more particles
being distributed around the AA powders and melted
in the molten pool. Therefore, the crack density and
porosity of 0.3 w.t.% Zr-modified alloy were not further
characterized in this study.
Cracking is one of the main reasons that results in
voids, particularly in LPBF 7075 alloy bulks. Crack density
on both xz and xy planes was calculated and plotted, as Figure 6. Crack density on xz and xy planes of the LPBF AA7075 and 1
shown in Figure 6. The crack density on xz plane of w.t.% Zr-modified AA7075 under different VED.
AA7075 ranges in 1.50 ×10 /μm – 1.71 ×10 /μm with
−3
−3
minor fluctuation under various VED. With 1 w.t.% Zr 3
addition, the corresponding crack density decreased to When the VED is above 82 J/mm , the samples display
−4
−4
the range of 3.69 × 10 /μm – 9.38 × 10 /μm. The cracks low porosity on both planes, confirming that we obtained
density leveled off with VED higher than 69 J/mm . The crack-free components with low porosity.
3
crack density on xy plane was much higher than that on the 3.4. Microstructure
xz plane. A large reduction in crack density was observed
on the xy plane with Zr addition. A peak emerged at 69 J/ A group of samples with scanning speed of 1100 mm/s
mm VED. The crack density decreased to as low as 1.34 and laser power ranging from 250 W to 325 W were
3
3
−3
−3
3
× 10 /μm and 1.03 × 10 /μm at 82 J/mm and 90 J/mm , further characterized to investigate the microstructural
3
3
respectively. evolution. Their VED values – 63 J/mm , 69 J/mm , 76 J/
mm , and 82 J/mm – are shown in Table 2. Figure 8 shows
3
3
3.3. Porosity the representative microstructure of these samples. The
3
Porosity is another main factor for relative density. Figure 7 sample with VED at 63 J/mm exhibited coarse and long
shows the calculated porosity based on OM images on cracks propagating through numerous layers, as seen
the xz and xy planes. Overall, the Zr-modified AA7075 in Figure 8A. When the laser power increased from 250
show higher porosity over the low VED range. When the W to 300 W, cracks propagating within shorter distance
VED goes up, the porosity decreases to even lower than were observed. In Figure 8D, few cracks were observed,
that in AA7075. An obvious negative correlation between indicating that low crack density can be achieved with
porosity on xy plane and VED was observed. This indicates high laser energy input. Figure 8M-P show the detailed
that alloys with Zr addition require higher energy input. structures inside the molten pool. Large columnar grains
Volume 1 Issue 1 (2022) 6 https://doi.org/10.18063/msam.v1i1.4