
Page 100 - MSAM-3-2
P. 100
Materials Science in Additive Manufacturing NiTi lattice: Performance optimization
The process parameters shown in Table 1 were selected 2.2. Measurement and characterization
for manufacturing. Pre-heating at a temperature of 200°C 2.2.1. Macro- and micro-scopic characterization
was required before printing. Before printing the sample,
a layer of thin plate was printed with the same parameters The lattice-structured samples prepared by LPBF were
for heat accumulation, so that the NiTi powder could measured for their dimensions using a vernier caliper
efficiently melt and adhere to the substrate. The parameters (smallest scale division of 0.01 mm) and weighed using an
were optimized by the orthogonal experiment method. 27,28 electronic balance (smallest scale increments of 0.1 mg).
It is worth noting that the layer thickness was 30 μm and The surface and fracture surfaces of the samples were
the hatch space was 100 μm in the NiTi sample fabricated characterized using a Quanta 650 FEG scanning electron
by LPBF process. Ge et al. have discussed the utilization microscope (FEI, USA) with a chamber’s air pressure of <8
of different laser powers and scanning speeds for × 10 Pa.
-3
manufacturing. The laser power employed in this study
27
was 125 W, and the scanning speed was 600 mm/s. 2.2.2. Static compression test
It should be noted that the entire LPBF fabrication Typically, additive-manufactured parts exhibit significant
process was carried out in an inert gas (argon) atmosphere anisotropy, whereas the anisotropy of the compressive
to avoid oxidation of the NiTi powder and the additive- mechanical properties of additive-manufactured TPMS
29
manufactured parts. Upon completion of printing, the lattice structures is relatively small. Therefore, we only
sample was cut from the substrate using wire electrical attempted to study the compressive mechanical behavior
discharge machining and then placed in a 99% alcohol in the printing direction (Z-axis) in the present work.
solution for ultrasonic cleaning for 15 min to remove The NiTi samples were tested using a materials high-
residual powder particles from the surface. Finally, the temperature performance testing machine (AG-IC
sample was dried using a high-pressure air gun. The 100 kN, Shimadzu, Japan). Uniaxial compression tests
finished sample is shown in (Figure 1E). were conducted at room temperature using two devices
with top and bottom loading heads. The compression rate
was 0.02 mm/s according to ISO 13314:2011. 30
A B
2.2.3. Dynamic compression-compression fatigue test
The compression-compression fatigue test was performed
at room temperature using an electrohydraulic servo
thermal fatigue testing machine (EHF-UK100K2-040-1A,
D Shimadzu, Japan). The loading frequency was set to 30 Hz;
C
the loading curve took the shape of a sinusoidal waveform;
and the load ratio R was set to 0.1. The cycle of the test
stop was set to 10 . The loading stress value of 0.3–0.7 σ
6
s
was selected as the loading condition for the fatigue test.
σ is defined as a yield strength value of 0.2%. BCC-10%
s
load stress values were 1.71 MPa, 2.28 MPa, 2.86 MPa, 3.43
MPa, and 4.00 MPa, whereas I-WP-10% load stress values
E
were 1.85 MPa, 2.47 MPa, 3.09 MPa, 3.71 MPa, and 4.33
MPa. For each loading condition, two samples were tested.
2.3. Finite element analysis simulation
ABAQUS (2020 version) was used to simulate the static
compression test. The boundary conditions were applied
to the model, the lower boundary was fixed, and the upper
boundary moved downward. General contact and a penalty
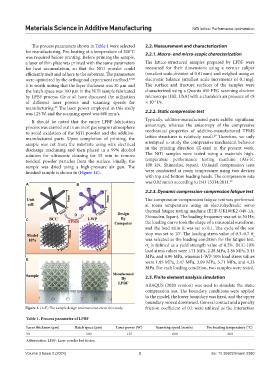
Figure 1. (A-E) The sample design and manufacture of this study. friction coefficient of 0.1 were utilized as the interaction
Table 1. Process parameter of LPBF
Layer thickness (µm) Hatch space (µm) Laser power (W) Scanning speed (mm/s) Pre‑heating temperature (°C)
30 100 125 600 200
Abbreviation: LPBF: Laser powder bed fusion.
Volume 3 Issue 2 (2024) 3 doi: 10.36922/msam.3380