
Page 105 - MSAM-3-2
P. 105
Materials Science in Additive Manufacturing NiTi lattice: Performance optimization
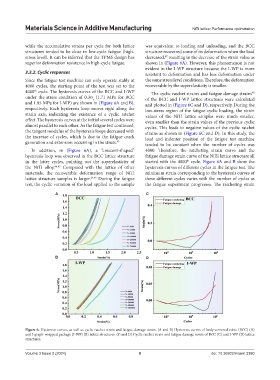
while the accumulative strains per cycle for both lattice was equivalent to loading and unloading, and the BCC
structures tended to be close in low-cycle fatigue (high- structure recovered some of its deformation when the load
stress level). It can be inferred that the TPMS design has decreased, resulting in the decrease of the strain value as
47
superior deformation resistance in high-cycle fatigue. shown in (Figure 6A). However, this phenomenon is not
evident in the I-WP structure because the I-WP is more
3.3.2. Cyclic responses resistant to deformation and has less deformation under
Since the fatigue test machine can only operate stably at the same stress level conditions. Therefore, the deformation
4000 cycles, the starting point of the test was set to the recoverable by the superelasticity is smaller.
4000 cycle. The hysteresis curves of the BCC and I-WP The cyclic ratchet strains and fatigue damage strains
th
48
under the stress condition of 0.3σ (1.71 MPa for BCC of the BCC and I-WP lattice structures were calculated
s
and 1.85 MPa for I-WP) are shown in (Figure 6A and B), and plotted in (Figure 6C and D), respectively. During the
respectively. Each hysteresis loop moves right along the low-stress region of the fatigue cyclic loading, the strain
strain axis, indicating the existence of a cyclic ratchet values of the NiTi lattice samples were much smaller,
effect. The hysteresis curves at the initial several cycles were even smaller than the strain values of the previous cyclic
almost parallel to each other. As the fatigue test continued, cycles. This leads to negative values of the cyclic ratchet
the tangent modulus of the hysteresis loops decreased with strains as shown in (Figure 6C and D). In this study, the
the increase of cycles, which is due to the fatigue crack load and indenter position of the fatigue test machine
generation and extension occurring in the struts. 43 tended to be constant when the number of cycles was
In addition, in (Figure 6A), a “crescent-shaped” 4000. Therefore, the ratcheting strain curve and the
hysteresis loop was observed in the BCC lattice structure fatigue damage strain curve of the NiTi lattice structure all
in the latter cycles, pointing out the superelasticity of started with the 4000 cycle. Figure 6A and B show the
th
the NiTi alloy. 44,45 Compared with the lattice of other hysteresis curves of different cycles in the fatigue test. The
materials, the recoverable deformation range of NiTi minimum strain corresponding to the hysteresis curves of
lattice structure samples is larger. 24,46 During the fatigue these different cycles varies with the number of cycles as
test, the cyclic variation of the load applied to the sample the fatigue experiment progresses. The ratcheting strain
A C C
B D
Figure 6. Hysteresis curves, as well as cyclic ratchet strain and fatigue damage strain. (A and B) Hysteresis curves of body-centered cubic (BCC) (A)
and I-graph-wrapped package (I-WP) (B) lattice structures. (C and D) Cyclic ratchet strain and fatigue damage strain of BCC (C) and I-WP (D) lattice
structures.
Volume 3 Issue 2 (2024) 8 doi: 10.36922/msam.3380